How to assess the methodological quality of a study.
.png)
This blog is following on from last week’s topic How to critically appraise a paper. The main difference between critically appraising a paper and conducting a methodological quality assessment is that a critical appraisal usually involves the entire paper while a methodological quality assessment specifically focuses on the methods and results section.
Hi everyone,
This blog is following on from last week’s topic How to critically appraise a paper. The main difference between critically appraising a paper and conducting a methodological quality assessment is that a critical appraisal usually involves the entire paper while a methodological quality assessment specifically focuses on the methods and results section.
A methodological quality assessment is usually only conducted when writing a systematic review and provides us with information about the potential risks of bias in the paper.
There a many different tools/scales you can use when completing your quality assessment, the key is finding the correct one.
The table below provides examples of some of the available tools, make sure you select the tool appropriate to the design of your studies.
*Note this is not an exhaustive list of tools, you lecturers may have different preferences.
| Study Design |
Tool |
Scoring |
| RCTs Individually-randomized, parallel-group and cluster-randomized trials |
Low Risk: If the first three questions are answered with “yes”, and no important concerns related to the last three domains are identified Moderate Risk: If the case is assessed in 2 domains with “unclear” or “no”, High Risk: If the case is assessed in 3 domains with “unclear” or “no”, then |
|
| RCTs in physiotherapy |
Each satisfied item (except the first item) contributes 1 point to the total |
|
| RCTs |
|
|
| Non-randomised clinical Intervention (quasi- experimental) |
Risk Of Bias In Non-randomised Studies - of Interventions (ROBINS-I) |
No numerical grading- judgement of assessor |
| No numerical grading- judgement of assessor |
||
| No numerical grading- judgement of assessor |
||
| Cohort study (prospective cohort study, retrospective cohort study, and ambidirectional cohort study) |
|
Low Risk: 3 or 4 stars in selection domain AND 1 or 2 stars in comparability domain AND 2 or 3 stars in outcome/exposure domain Moderate Risk: 2 stars in selection domain AND 1 or 2 stars in comparability domain AND 2 or 3 stars in outcome/exposure domain High Risk: 0 or 1 star in selection domain |
| No numerical grading- judgement of assessor |
||
| Case-control study |
Newcastle-Ottawa Scale (NOS) for case-control studies
|
Low Risk: 3 or 4 stars in selection domain AND 1 or 2 stars in comparability domain AND 2 or 3 stars in outcome/exposure domain Moderate Risk: 2 stars in selection domain AND 1 or 2 stars in comparability domain AND 2 or 3 stars in outcome/exposure domain High Risk: 0 or 1 star in selection domain OR 0 stars in comparability domain OR 0 or 1 stars in outcome/exposure domain |
| No numerical grading- judgement of assessor |
||
| Cross-sectional study (analytical or descriptive) |
No numerical grading- judgement of assessor |
|
| Case series and case reports |
No numerical grading- judgement of assessor |
|
| Diagnostic study |
No numerical grading- judgement of assessor |
|
| No numerical grading- judgement of assessor |
||
| Health economic evaluation |
No numerical grading- judgement of assessor |
|
| No numerical grading- judgement of assessor |
||
| Qualitative study |
No numerical grading- judgement of assessor |
|
| No numerical grading- judgement of assessor |
||
| Prediction studies |
No numerical grading- judgement of assessor |
|
| Clinical practice guidelines |
Appraisal of Guidelines for Research and Evaluation (AGREE) II instrument |
No numerical grading- judgement of assessor |
Now that you have completed your quality assessment how do you present it in your systematic review?
The below tables are examples of how to present the results of your quality assessment (risk of bias within studies).
Table 2: Outcomes of Cochrane Risk of Bias tool displaying risk of bias within studies.
| Author(s) (yr) |
Random Sequence |
Allocation |
Blinding |
Blinding |
Addressed incomplete |
Free of Selective |
Free of Other sources |
High/Moderate/ Low Risk |
| Anguish and Sandrey. (2018) (58) |
Y |
Y |
N |
N |
Y |
Y |
U |
Low |
| Burcal et al. (2017) (55) |
Y |
Y |
N |
N |
N |
Y |
N |
Moderate |
| Cloak et al. (2010) (61) |
U |
N |
N |
N |
U |
Y |
N |
High |
| Cruz-Diaz et al. (2015) (62) |
Y |
Y |
N |
Y |
Y |
Y |
Y |
Low |
| Hall et al. (2015) (59) |
U |
N |
U |
N |
Y |
N |
U |
High |
| Hall et al. (2018) (56) |
U |
N |
N |
N |
Y |
N |
N |
High |
| Linens et al. (2016) (57) |
U |
U |
U |
N |
U |
Y |
U |
High |
| Melam et al. (2018) (63) |
U |
U |
N |
U |
U |
Y |
N |
High |
| Sierra-Guzmán et al. (2018) (64) |
Y |
Y |
N |
Y |
Y |
Y |
U |
Low |
| Smith et al. (2018) (60) |
Y |
N |
N |
N |
Y |
Y |
N |
Moderate |
| Y = yes, N = no, U = unclear |
|
|
|
|
|
|
|
|
Table 5: Outcomes of van Tulder Scale.
| Author(s) (yr) |
Randomization |
Allocation concealment |
Similar baseline |
Patient blinding |
Investigator |
Outcome assessor |
Co-intervention |
Compliance |
Dropout rate |
Intention to treat analysis |
End-point |
Total |
|
| Anguish and Sandrey (2018) |
Y |
Y |
U |
N |
Y |
N |
N |
Y |
Y |
Y |
Y |
7 |
|
| Burcal et al. (2017) |
Y |
Y |
Y |
N |
N |
N |
Y |
U |
U |
U |
Y |
5 |
|
| Cloak et al. (2010) |
U |
N |
Y |
N |
N |
N |
Y |
U |
U |
U |
Y |
3 |
|
| Cruz-Diaz et al. (2015) |
Y |
Y |
Y |
N |
N |
Y |
N |
Y |
Y |
U |
Y |
7 |
|
| Hall et al. (2015) |
U |
N |
Y |
U |
N |
N |
Y |
Y |
Y |
N |
Y |
5 |
|
| Hall et al. (2018) |
U |
N |
U |
N |
N |
N |
Y |
Y |
Y |
N |
Y |
4 |
|
| Linens et al. (2016) |
U |
U |
Y |
U |
U |
N |
Y |
Y |
U |
N |
Y |
4 |
|
| Melam et al. (2018) |
U |
U |
Y |
U |
U |
U |
Y |
U |
U |
N |
Y |
3 |
|
| Sierra-Guzmán et al. (2018) |
Y |
Y |
Y |
N |
Y |
Y |
Y |
U |
Y |
N |
Y |
8 |
|
| Smith et al. (2018) |
Y |
N |
Y |
N |
N |
N |
Y |
U |
Y |
N |
Y |
5 |
|
| Y = yes, N = no, U = unsure; Bold values signify total van Tulder Scale scores ≥ 5. |
|||||||||||||
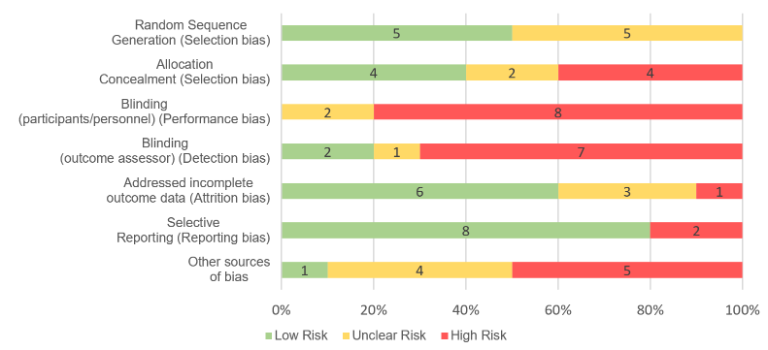
Lastly, If you want to display the risk of bias across the studies included in your review, use the same information from your table but group the studies together under each item (e.g for random sequence generation, 5 studies were determined low risk and 5 were classified as unclear risk) (figure example below).
Figure 1: Overall risk of bias across studies
Thanks everyone for reading and I hope this helps. Next week, I will have a guest blogger. My friend and co-tutor Maura Bendix will be here next week to share her knowledge.
See you soon,
Leanne
Skills Centre
Contact us
Q -1 (Q minus 1), UCC Boole Library,