In This Section
- Home
- Semester and Timetable Information
- Study Physics
- Our Research
- Our People
- Careers and Alumni
- Seminars, News and Events
- Outreach and School Resources
- About the School
- What is Physics
- The Crawford Observatory
- Frequently Asked Questions
- UCC Futures Quantum & Photonics
- Supports/EDI
In this experiment students investigate the strange behaviour of water as it cools in comparision to other liquids and the phenomenon of supercooling. Supercooling is the process of chilling a liquid below its freezing point, without it becoming solid.
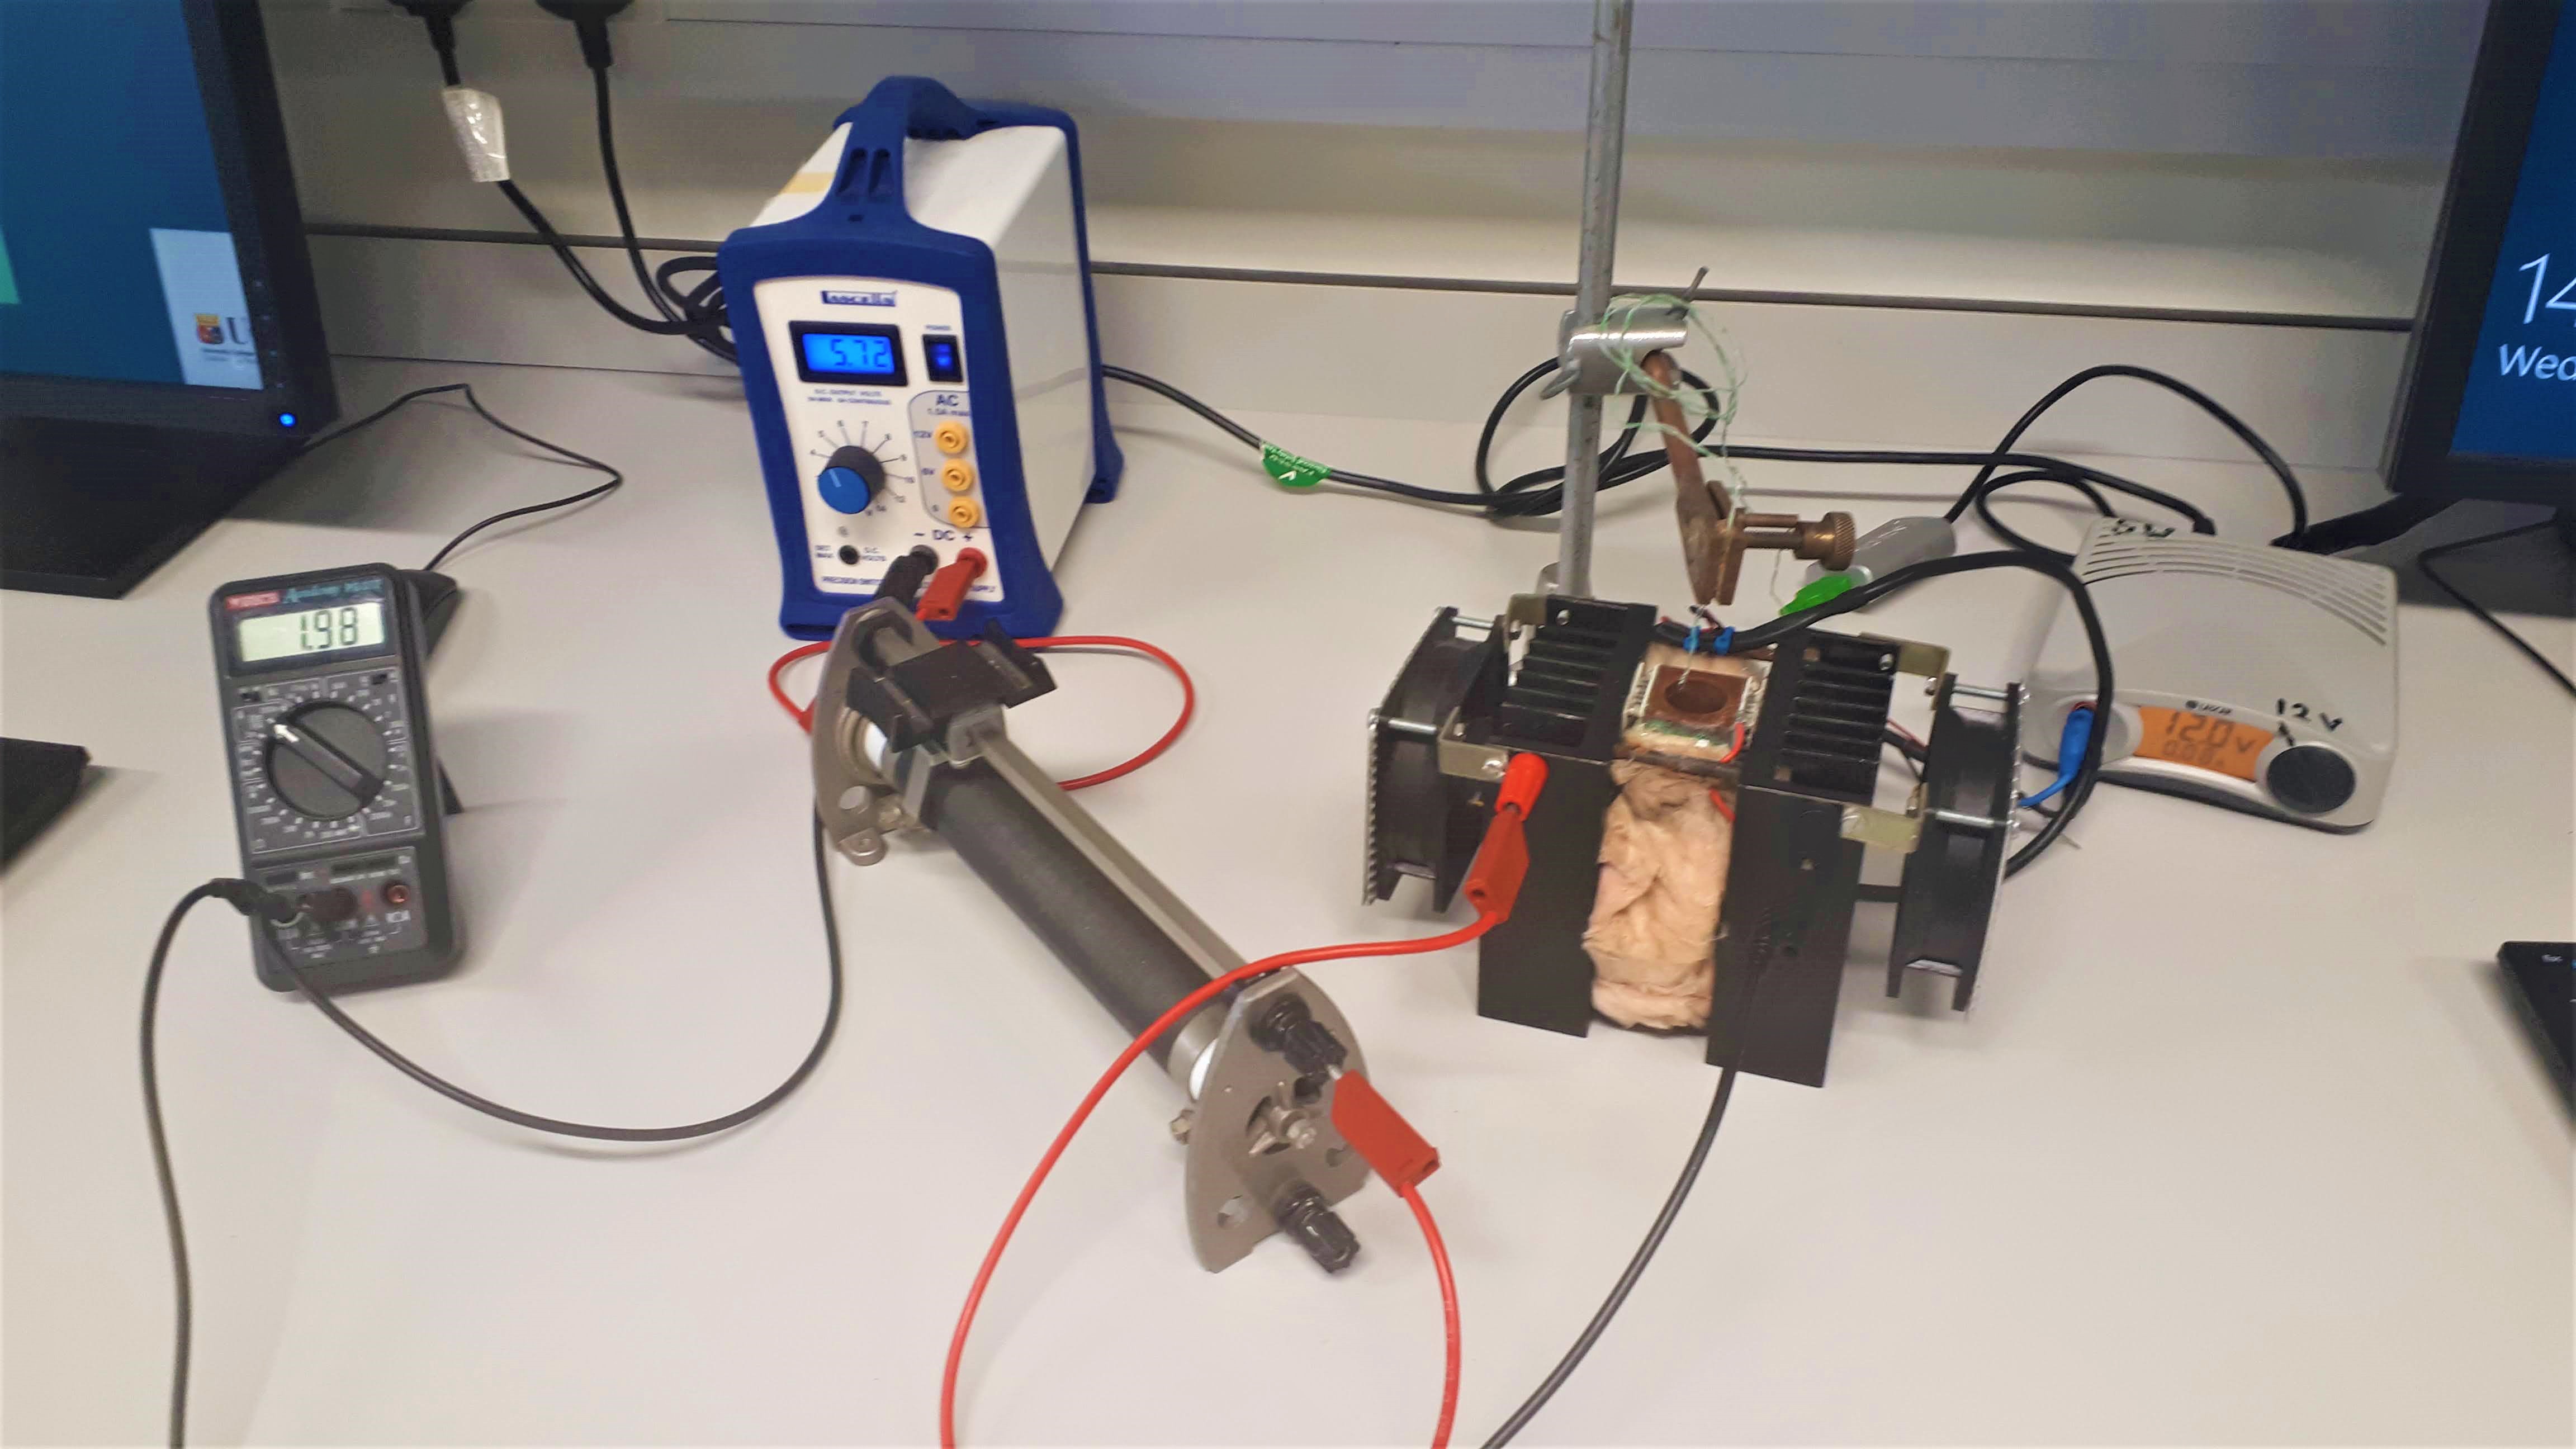
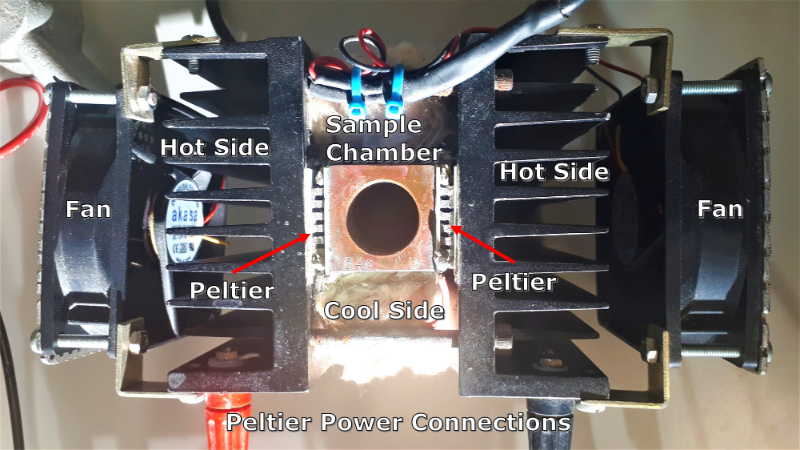
The apparatus used in the is experiment uses Peltier coolers to cool the samples. When a voltage is applied to a Peltier cooler the cooler removes heat from one side if itself and radiates it out the other side. This apparatus has two Peltier coolers, one on either side of a sample chamber, with the cooling sides beside the sample chamber and the hot sides placed against metal heat sinks with fans, which help remove all the heat from the appratus more quickly.
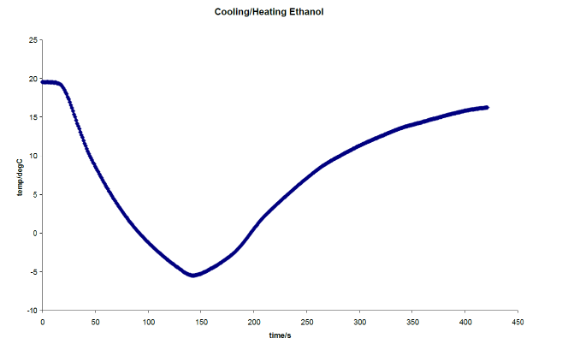
Students start by exploring the cooling curve for ethanol, a "normal" liquid. Note that ethanol freezes at -114°C. Students pour a known volume of ethanol into the sample chamber and power the Pelier coolers to begin cooling the sample. A thermocouple is used to measure the temperature of the sample. Thermocouples are explained in a previous experiment, however in this experiment it looks slightly different as it is not a rigid metal bar but fine metal wire that is used. The thermocouple is lowered into the sample chamber approximately halfway into the liquid sample to measure the temperature. As can be seen in the graph below the ethanol cools at a uniform rate down and then heats back up the same way.
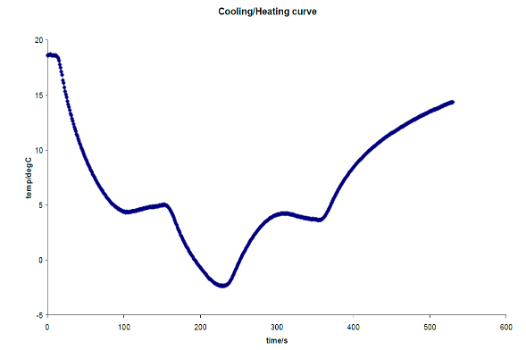
Students then repeat this experiment using water. As the water is cooled, students find a ‘plateau’ occurring at some temperature in the region of ~ 3°C to 7°C depending on how deep the thermocouple probe is below the surface. Students also investigate supercooling by seeing how far below 0°C they can cool the liquid before feezing occurs by expperimenting with different cooling rates. Finally the students cool the water below 0°C but now without allowing freezing to occur by stopping cooling at -1°C and then allowing the sample to warm up. A cooling curve for water like below is then obtained.
 |
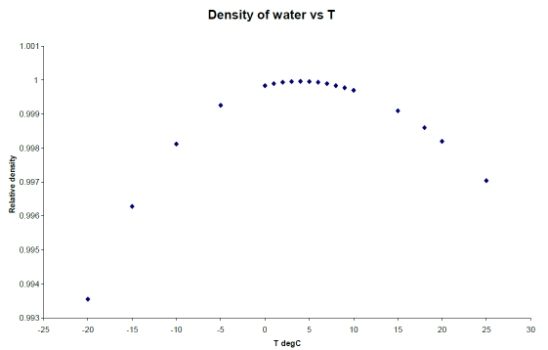 |
One sees that this is quite different from the curves for ethanol in that there are plateaus present both in the cooling and in the warm-up cycle. This is because of the unique property of water and it's density. Usually as a smaple goes from gas to liquid the solid the density of the sample continually gets greater and greater. This means the sample occupys a smaller space. However water is the only known non-metallic substance that expands when it freezes. At approximately 4°C (where the plateaus occur) the density of water stops increasing and starts to decrease, as can be seen in graph above. This can be seen in everyday life if one puts a bottle of water in the freezer, as the water freezes it expands and bursts out of the bottle.
This experiment compliments the earlier heat conduction experiment, allowing students to explore the the physics of heat in a range of environments.
School of Physics
Scoil na Fisice
Contact us
Room 213 (Physics Office), 2nd floor, Kane Science Building, University College Cork, Ireland.,