In This Section
- Home
- Semester and Timetable Information
- Study Physics
- Our Research
- Our People
- Careers and Alumni
- Seminars, News and Events
- Outreach and School Resources
- About the School
- What is Physics
- The Crawford Observatory
- Frequently Asked Questions
- UCC Futures Quantum & Photonics
- Supports/EDI
The photoelectric effect is a phenomenon in which electrically charged particles are released from or within a material when it absorbs electromagnetic radiation.(examples of electromagnetic radiation). The effect is often defined as the ejection of electrons from a metal plate when light falls on it.
Before this experiment light was believed to be a continious wave and that the energy of that wave could "build up" in the electrons of a material and when the electron had absorbed enough energy it would be emitted from the material. However this did not occur. Electrons were only emitted from the material when the light exceeds a certain frequency (the threshold frequency)—regardless of the light's intensity or duration of exposure. Therefore Albert Einstein proposed that a beam of light is not a wave propagating through space, but a collection of discrete wave packets, known as photons. A good visual explanation of this process can be seen in this simulation.
Einstein explained the threshold frequency f0 as follows. Some of the emergy of the photon is used to liberate the electron (for example by overcome an electrostatic potential as the electron leaves the metal surface) and the rest is converted into kinetic energy (the energy that allows the electron to move). If the total energy of the photon is h*f where h is Planck Constant and f is the frequency of light, and the energy used to liberats the electron is called the work function (φ) then the kinetic energy (KE) of the electron after beig liberated would be:
KE = hf - φ
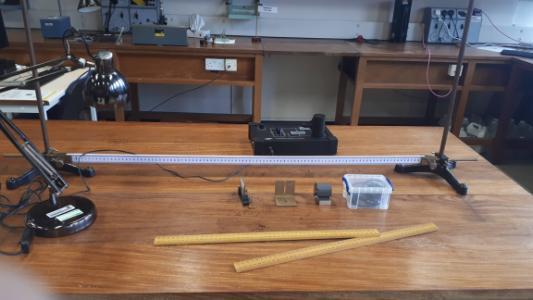
In this experiment students use a series of Light Emitting Diodes (LEDs) which emit photons over a narrow wavelength range, to illuminate a cathode and measure the resulting electron current. First the student must find the wavelength of the LED and then, using the phototelectric effect, they can derive values for the Planck constant h, and the caesium work function φ.
Part A: Wavelength Calibration of the LEDs
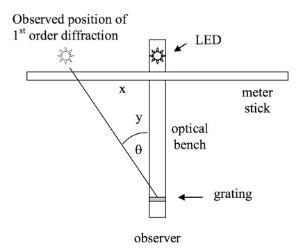
In the first part of the experiment students independently measure the wavelength of the LEDs, using a slit, grating and metre stick. The students measure the position of the first order diffraction pattern of the light from the LED, relative to the straight through position and calculate the wavelength λ using
dSin(θ) = nλ
where d is the distance between the slits, θ is the angle of diffraction, λ is the wavelength of the light, n is the order of diffraction.
You can try this experiment yourself using this online simulation: Diffraction Grating Laser Lab
 |
 |
Part 2: Measuring Planck’s Constant, and the Work Function
For this part the apparatus consists of a photocell, a voltmeter for measuring the EMF and Vmax, a nanoammeter for measuring the liberated electrons and a power supply. The photocell consists of a caesium coated cathode and anode in a vacuum.
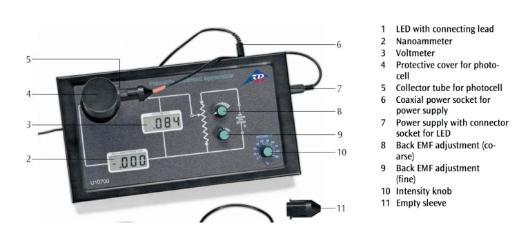
The LED into the collector tube in the apparatus allowing the light to illuminate the cathode. This causes electrons to be emitted from the cathode which then travel to the anode. This is essentially how a battery works, as such this process produces a voltage across the cathode and anode which can be measured. The student measures the max voltage produced by shining the LED on the cathode. This is then repeated for multiple wavelengths. The students can then plot the max voltage against the wavlength and from tht can calculate Planks constant and the work function of caesium.
You can try out this experiment yourself using these simulations/online labs:
School of Physics
Scoil na Fisice
Contact us
Room 213 (Physics Office), 2nd floor, Kane Science Building, University College Cork, Ireland.,