In This Section
- Home
- Semester and Timetable Information
- Study Physics
- Our Research
- Our People
- Careers and Alumni
- Seminars, News and Events
- Outreach and School Resources
- About the School
- What is Physics
- The Crawford Observatory
- Frequently Asked Questions
- UCC Futures Quantum & Photonics
- Supports/EDI
The electrons in an atom tend to be arranged in such a way that the energy of the atom is as low as possible. The ground state of an atom is the lowest energy state of the atom. When those atoms are given energy, the electrons absorb the energy and move to a higher energy level. These energy levels of the electrons in atoms are quantized, meaning again that the electron must move from one energy level to another in discrete steps rather than continuously. An excited state of an atom is a state where its potential energy is higher than the ground state. An atom in the excited state is not stable. When it returns back to the ground state , it releases the energy as light of certain wavelengths which correspond to different colors. The emitted light can be observed as a series of colored lines with dark spaces in between; this series of colored lines is called a line or atomic spectra. Each element produces a unique set of spectral lines. Since no two elements emit the same spectral lines, elements can be identified by their line spectrum.
The Balmer series is the name given to a series of spectral emission lines of the hydrogen atom. In this expeirmetn students use a lamp which has a hydrogen spectral tube. A spectral tube is a glass tube which has hydrogen gas inside. At the top and bottom of the tube there are electrodes. When current is apssed throught he electrons in the atoms in the hydrogen gas absorb the energy from the current. They then release this energy produsing the Balmer series.
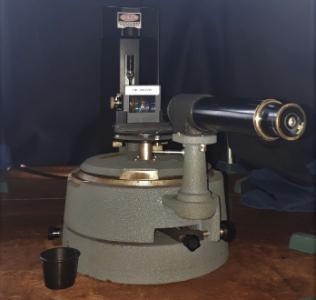
Student use a spectrometer to look at these lines. Spectrometer is a term for any instrument that can read wavelengths of light. There are now many PC based spectrometers that will read the wavelength and intensity of light and display the specta on the screen. However in this experiment students use a spectrometer that is much more hands on and allows students to see the spectral lines themselves. A diagram of the spectrometer can be seen below:
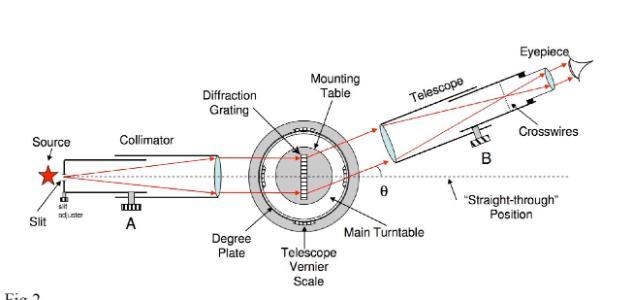
The light emitted from the hydrogen lamp enters the collimator which stops the light from spreading out in all directions and instead directs it just forward. The light then passes through a diffraction grating on the mounting table. The diffraction grating causes light of different wavelengths to be bent at different angles. This allows light of different wavelengths to be seperated. The telescope takes this light and focuses it. Students look in through the eyepiece and they can swivel the telescope around the mounting plate to see all the spectral lines.
The angle of each line can be measured using a scale on the mounting plate. The wavelwngth of each spectral line can be calculated using
dSin(θ) = nλ
where d is the distance between the slits, θ is the angle of diffraction, λ is the wavelength of the light, n is the order of diffraction.
You can try this lab yourself using this online lab: Diffraction Grating
You can explore other atmoic spectra using these simulations:
 |
 |
 |
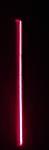
| Spectrometer with diffraction grating | Balmer Series line as seen in the straight-through position |
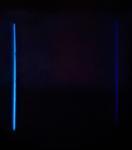
More Balmer series lines as seen by moving the lines away from the straight-through position |
School of Physics
Scoil na Fisice
Contact us
Room 213 (Physics Office), 2nd floor, Kane Science Building, University College Cork, Ireland.,