An update from PhD researcher Luke!
An update from PhD researcher Luke!
For the past few months, I have been processing samples from cores retrieved from our past cruises to the Porcupine Bank Canyon. In doing so, I will be able to characterise how the sediment changes downcore, using parameters such carbonate and organic percentages in tandem with sediment particle sizes. All these details can help me understand how the corals and, thus, the environment in the canyon has changed over time.
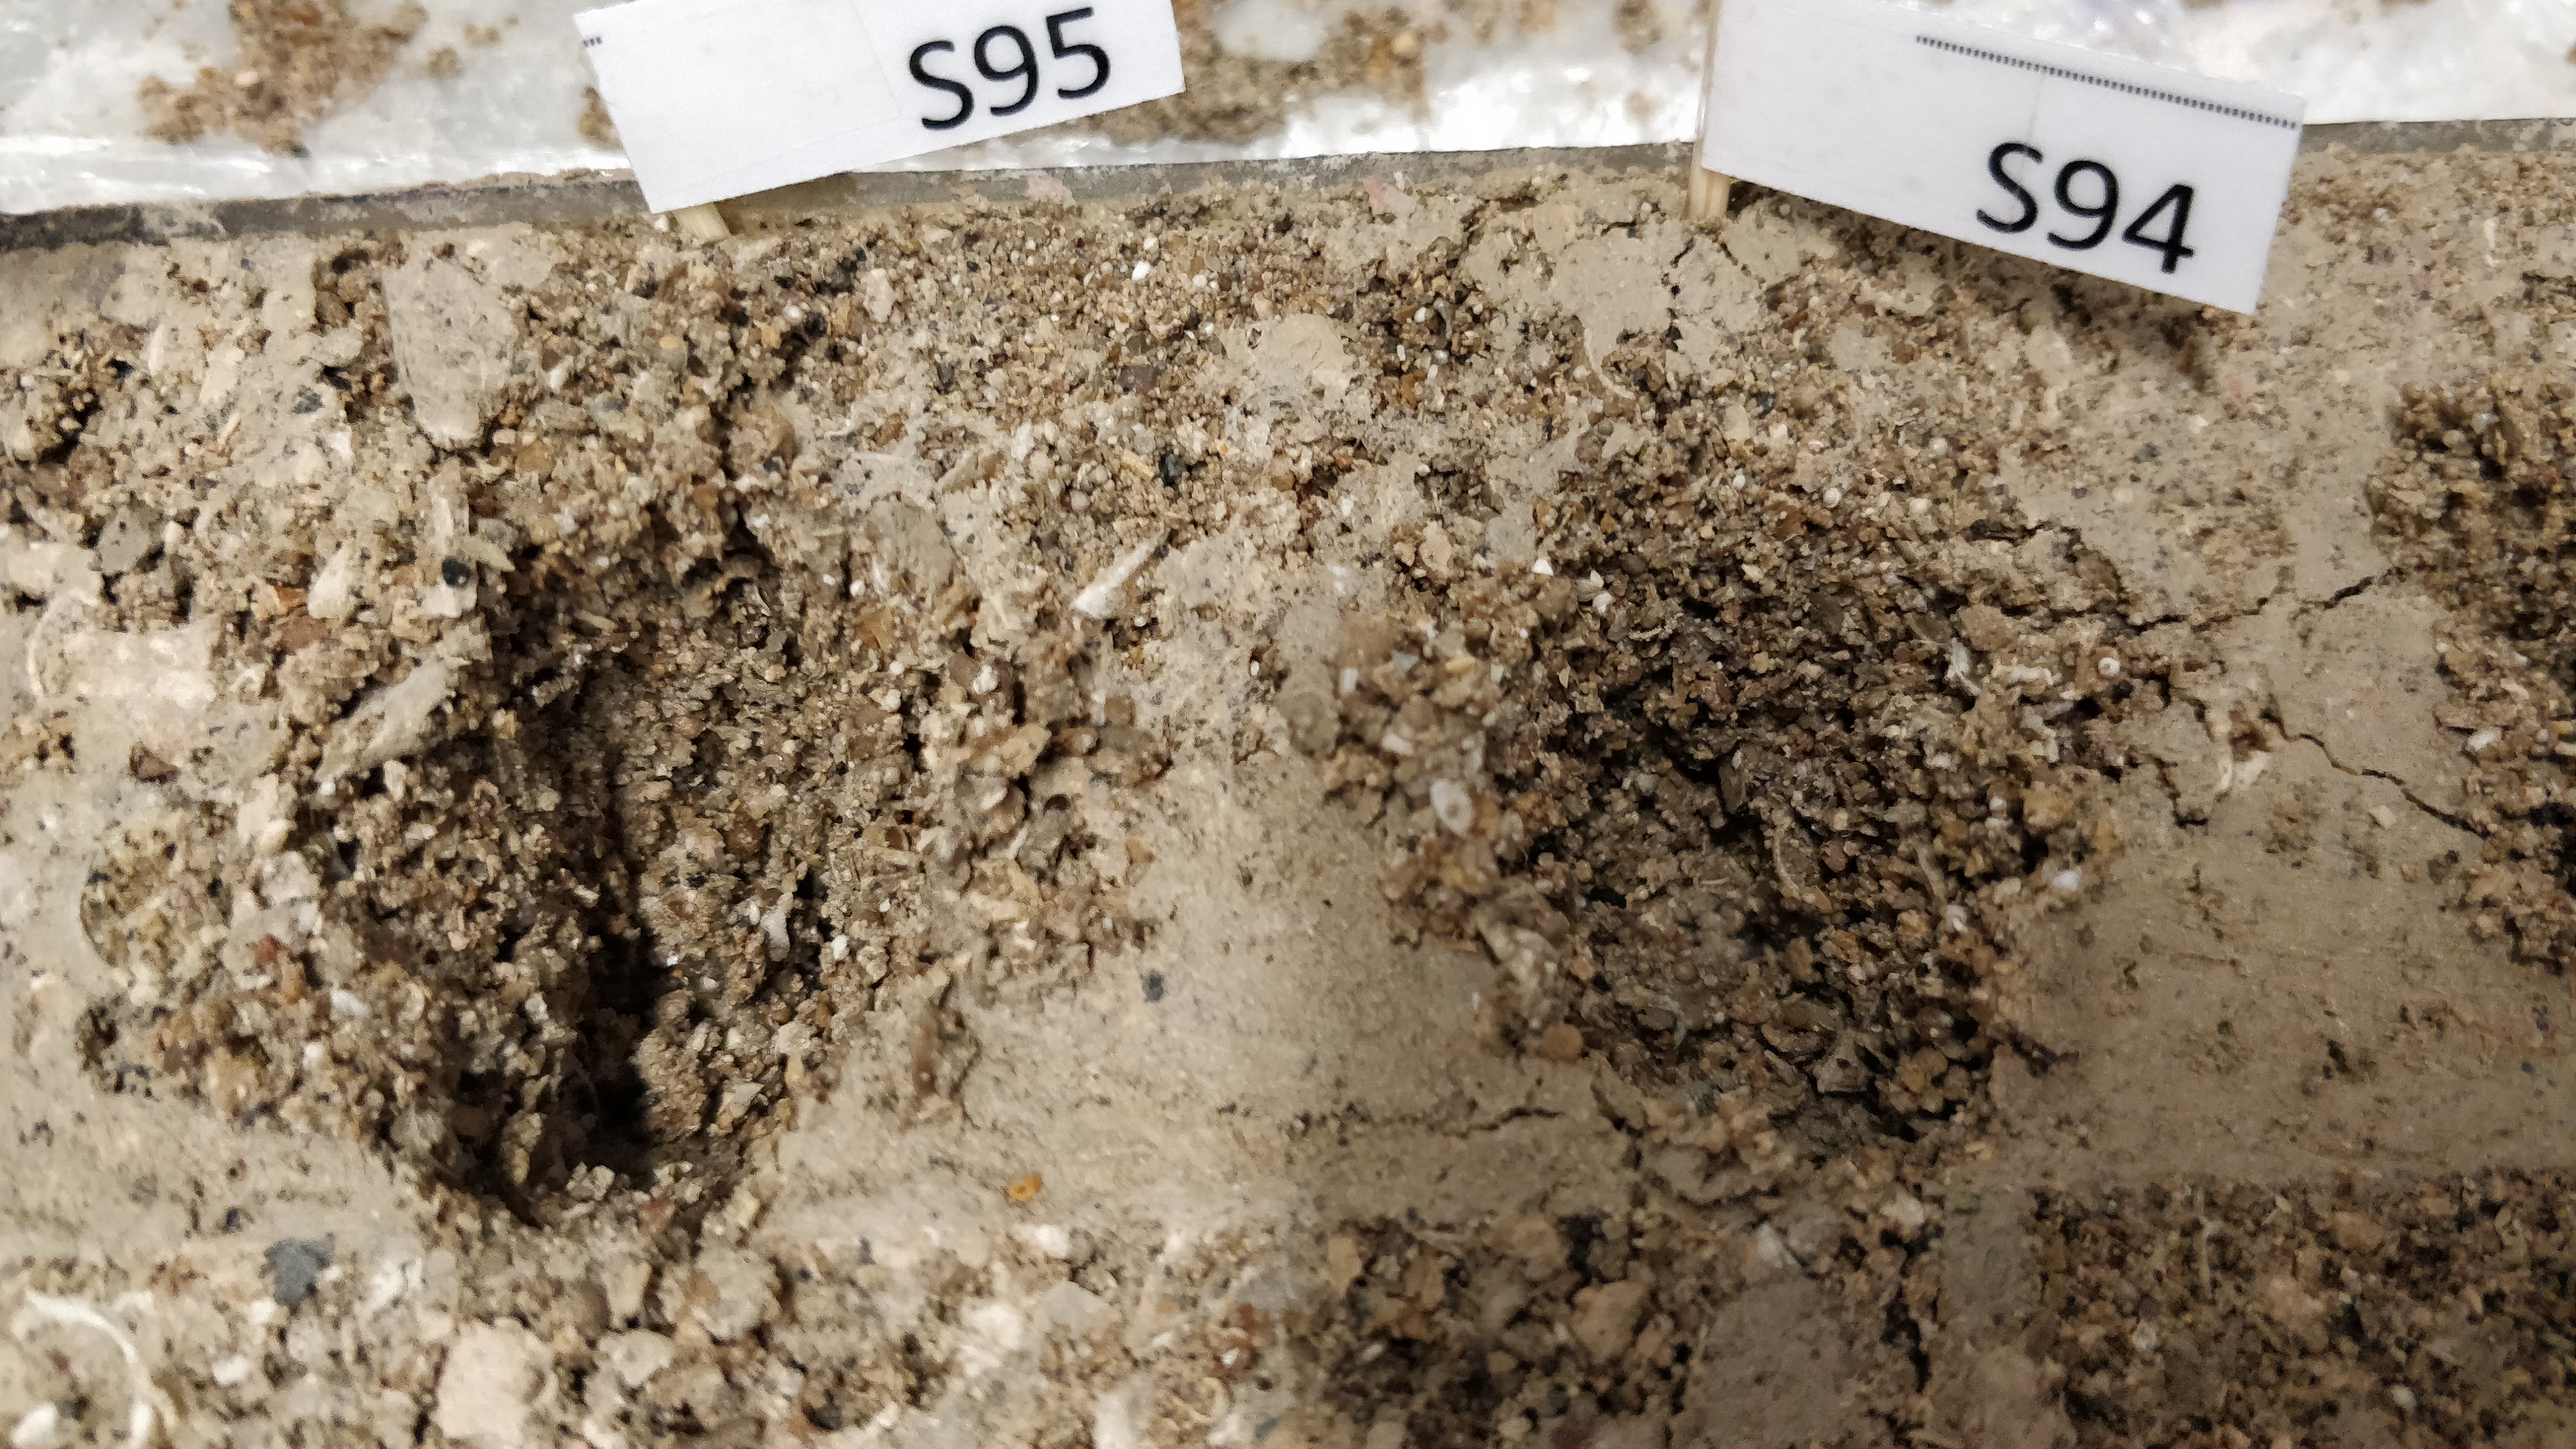
Firstly, it’s important to clarify how I sample a core. First, the cores are frozen and then halved. One half will be retained as an archive half, to ensure there will always be material to work on/refer to in the future. The other half (a.k.a. the “working half”) is then visually logged throughout, and then sampled every 5cms, or at places in the core where I can see something cool is happening. I also use CT-derived 3D imagery to help me find these boundaries. When I say sampling, I mean extracting sediment from the core, which can sometimes be troublesome, especially when sampling between intricate coral branching (See Fig 1).
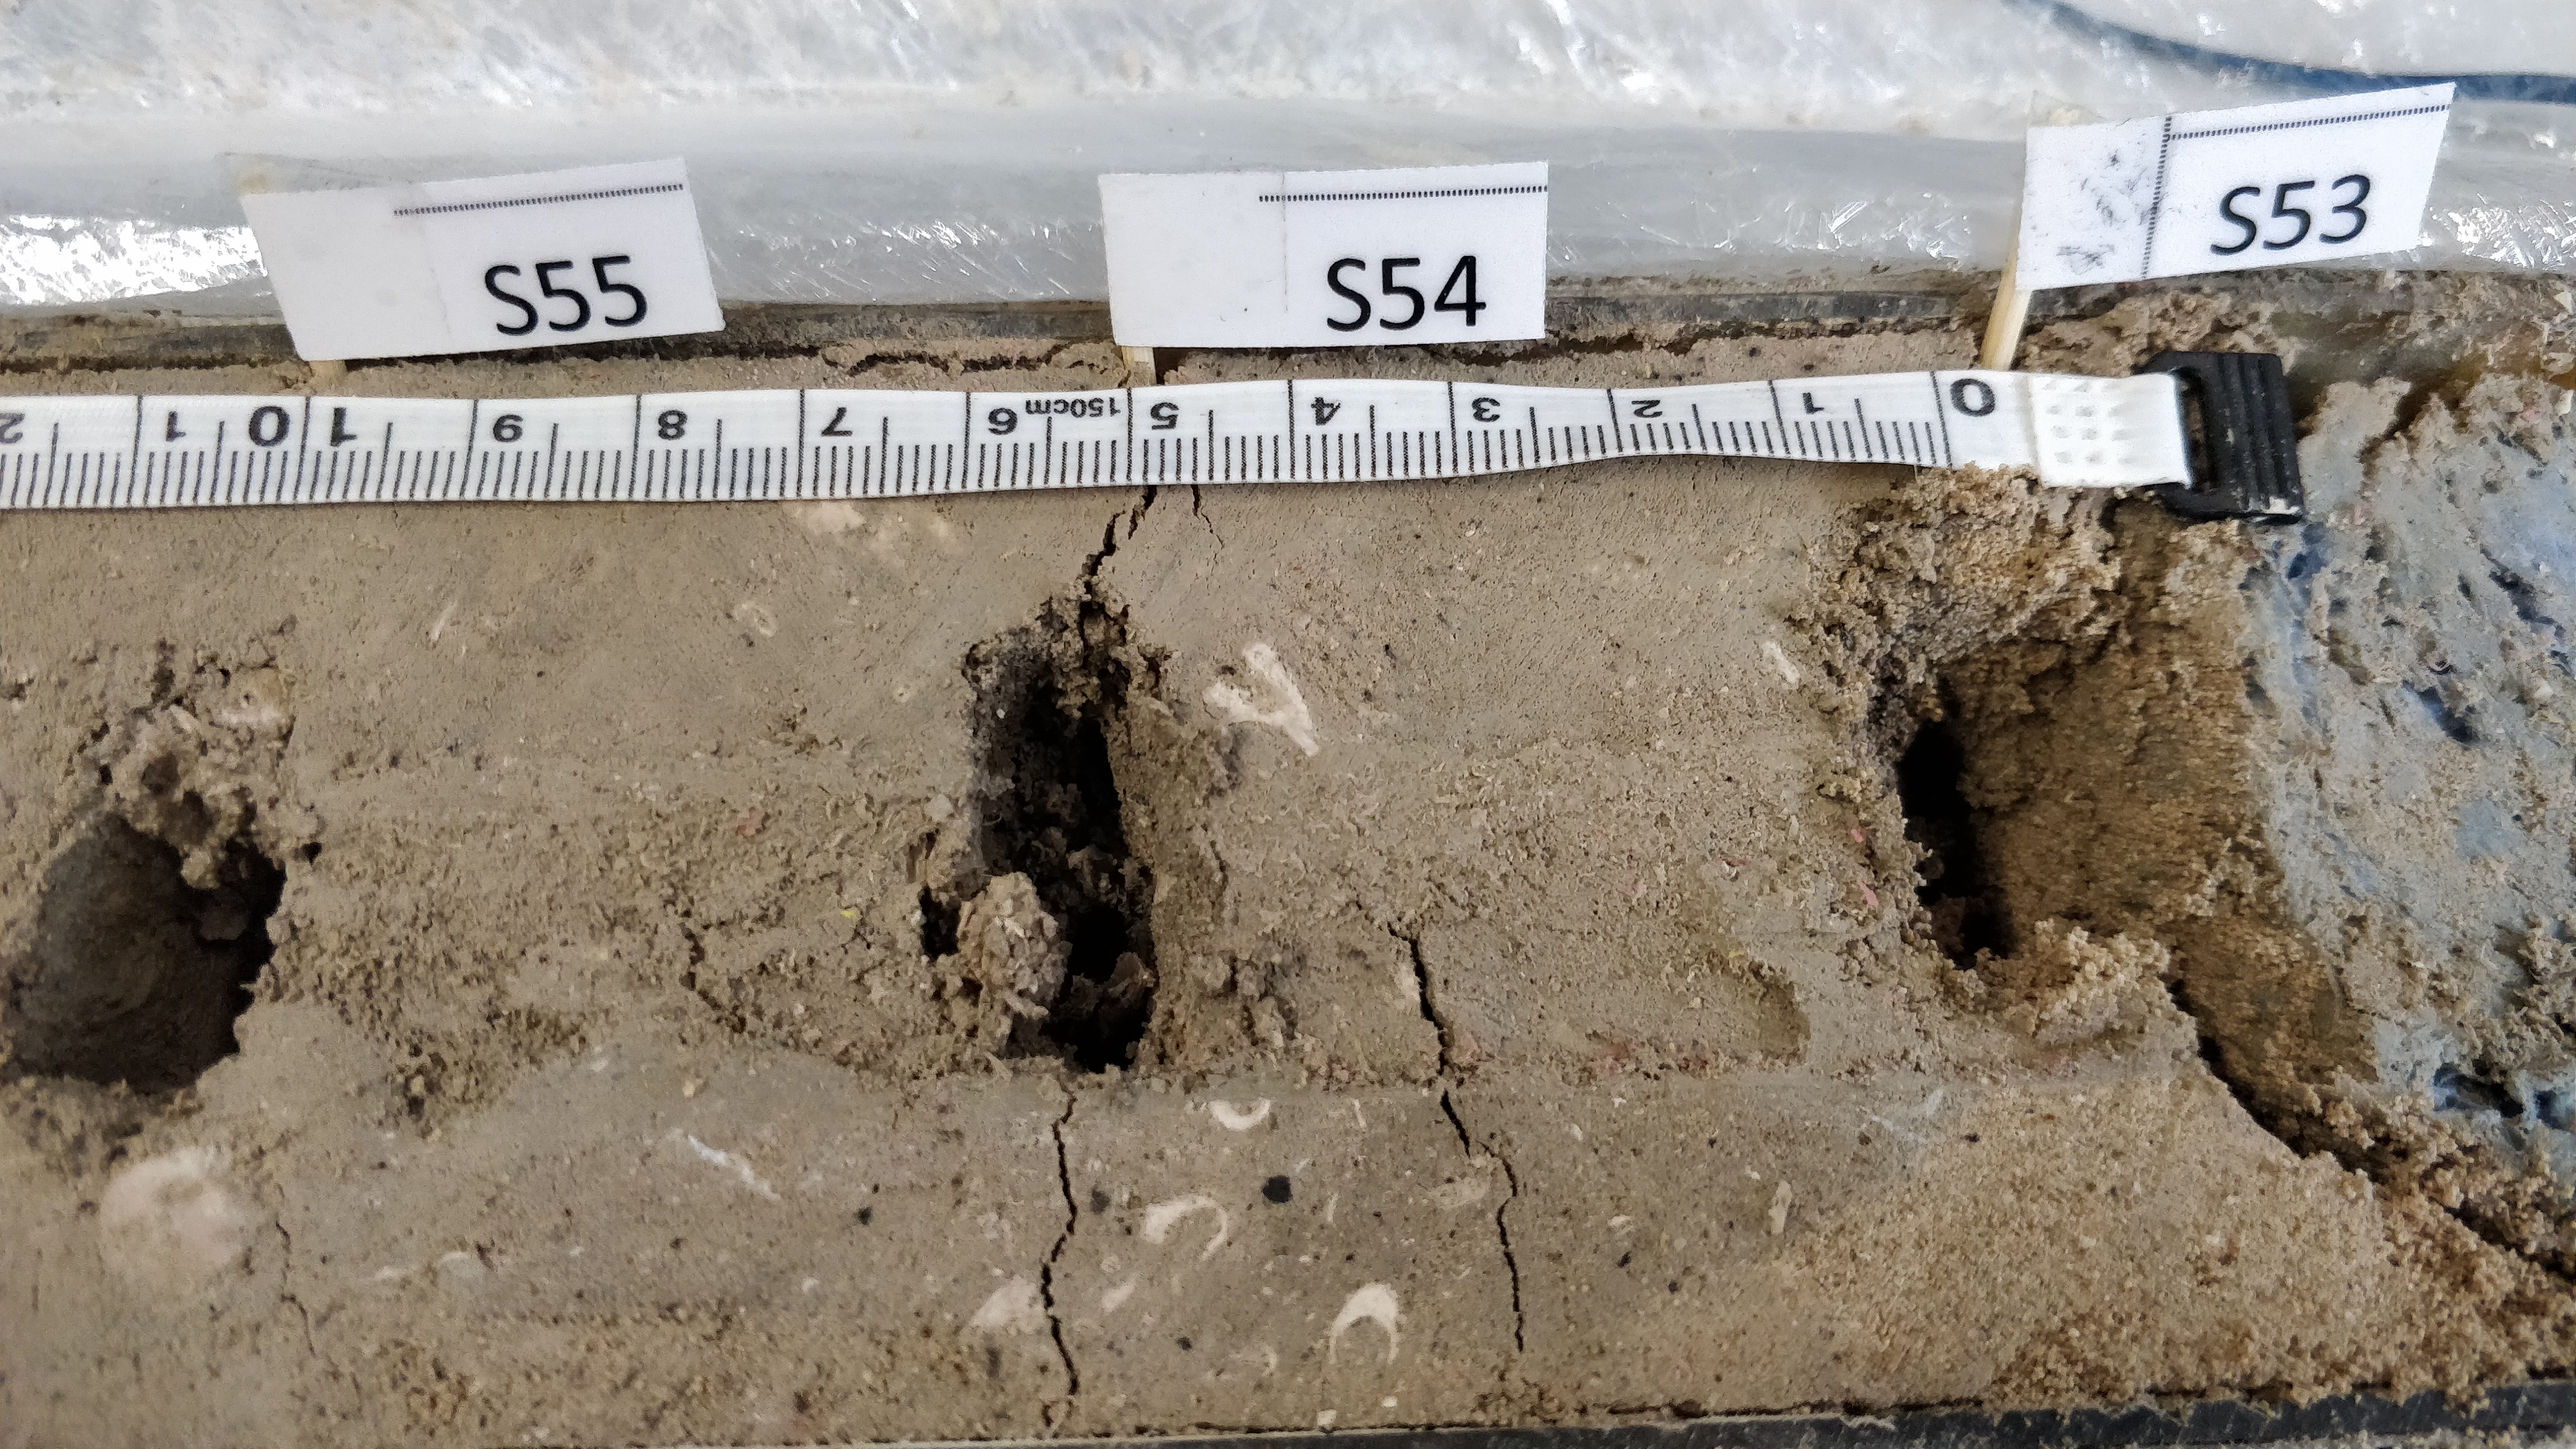
Fig 1: Sediment extraction from the core
I try to have roughly 1cm3 of sediment extracted per sample. This way, I leave enough sediment in the working half of the core to go over again for other types of processing. Next, I add the extracted sample into a weighed beaker and dry the sample at 60° in an oven for no less than 24 hours. In doing so, I can now weigh the sample using a very precise measuring scale (up to 5 decimal places), before subjecting it to carbonate dissolution or the likes (See Fig. 2). I also make sure during this step that no large pieces of coral, say greater than 2 mm are within the sample, as they are not really classified as sediment. If I include them in the experiment, I’ll have a major misrepresentation in my results.
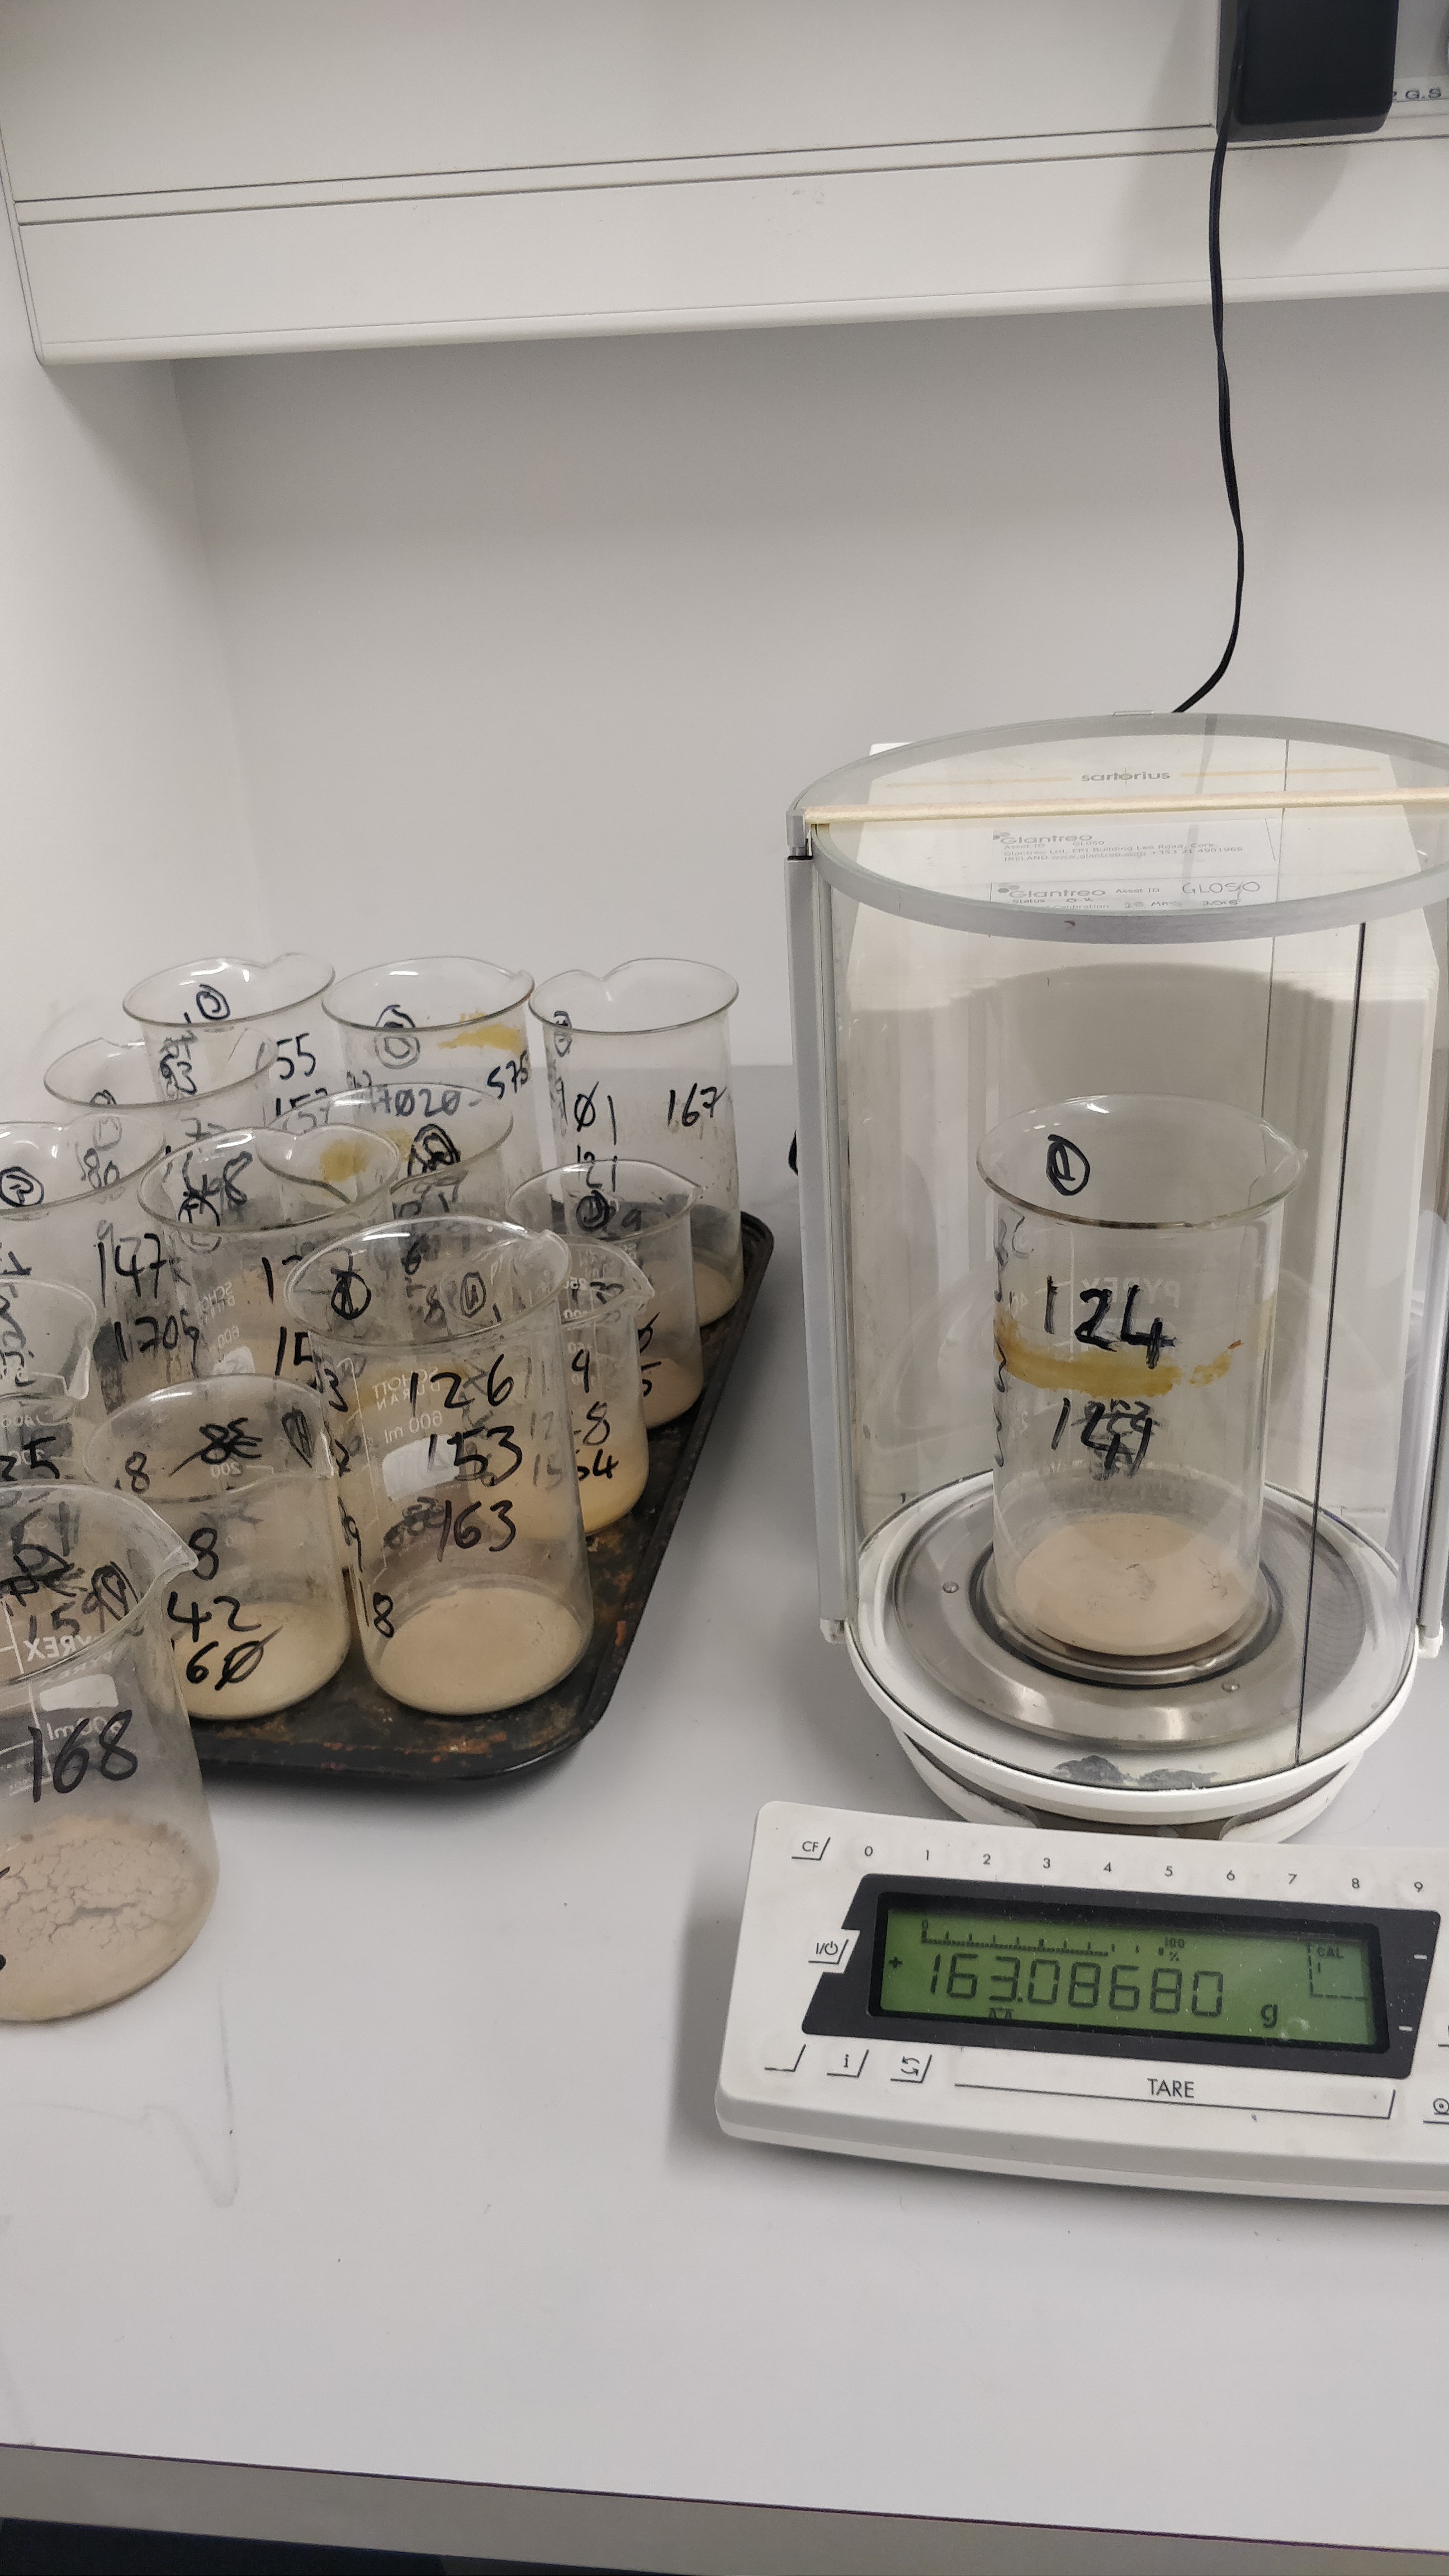
Fig 2: The weighing of the samples in beakers
Next is a two part process of dissolving/oxidizing all carbonate/organic material. Each part is done separate, but follows the same method, with the once exception of using by a solution of 10% HCL + distilled water for decarbonizing and 10% H202 + distilled water removing organic matter. Each solution is added to the sample in it’s respective beaker. The beaker is then heated on a hot plate for 2 hours (See Fig. 3).
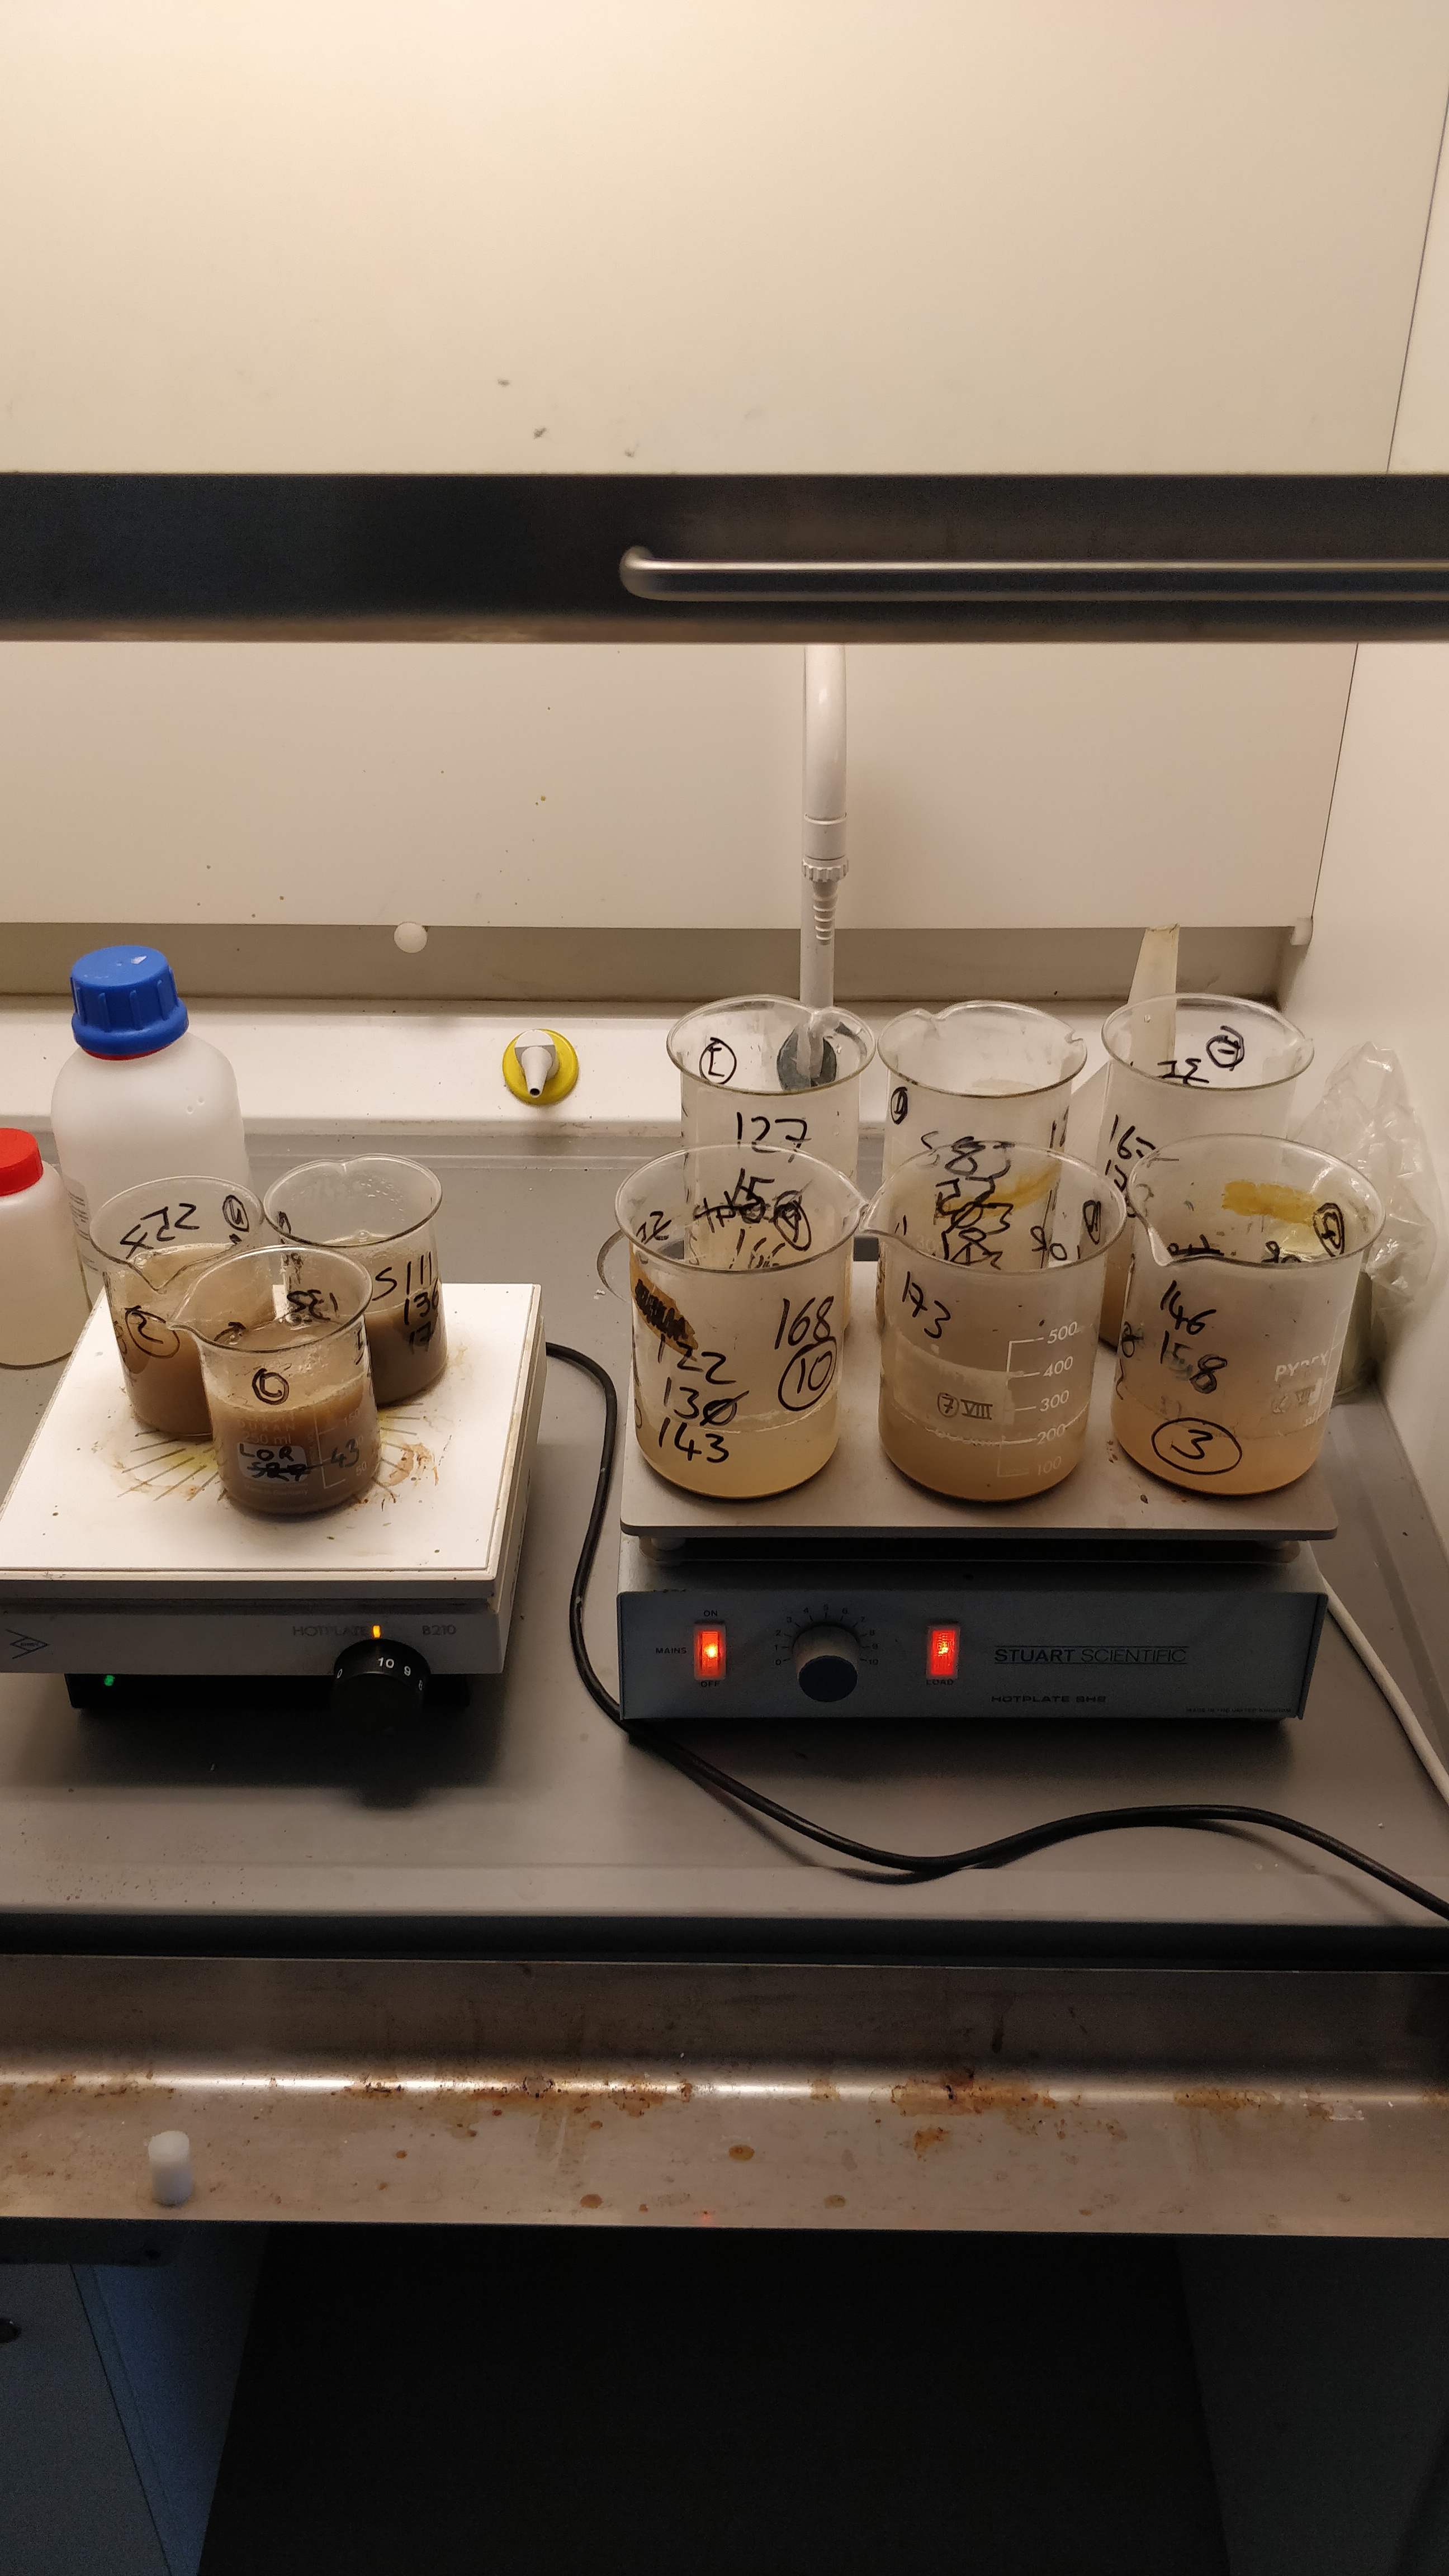
Fig 3: Two part process of dissolving/ oxidizing all carbonate/ organic material
After this reaction has taken place, I remove from heat, and leave the solution settle out for an hour, or until it is evident that all of the particles have settled to the base of the beaker. I then carefully remove the excess water with a syringe, ensuring that no sediment is being removed. The sample now needs to be dried, so back into the oven it goes for a further 24 hours. The now dried sample is then weighed, which now represents a sample that is free of carbonate or organic material (depending on which experiment you just ran), that can be calculated into a percentage. Handy out..
This now leaves me with the lithic fragment, which of course, can be composed of all types of rock types. I then put the sample through a 2mm sieve, which removes anything larger than sand (i.e pebbles). Anything which makes it through the sieve is rehoused into a test tube with distilled water (See Fig. 4). The removed fragment is also weighed and transferred into a test tube, which can be used for further sediment classification.
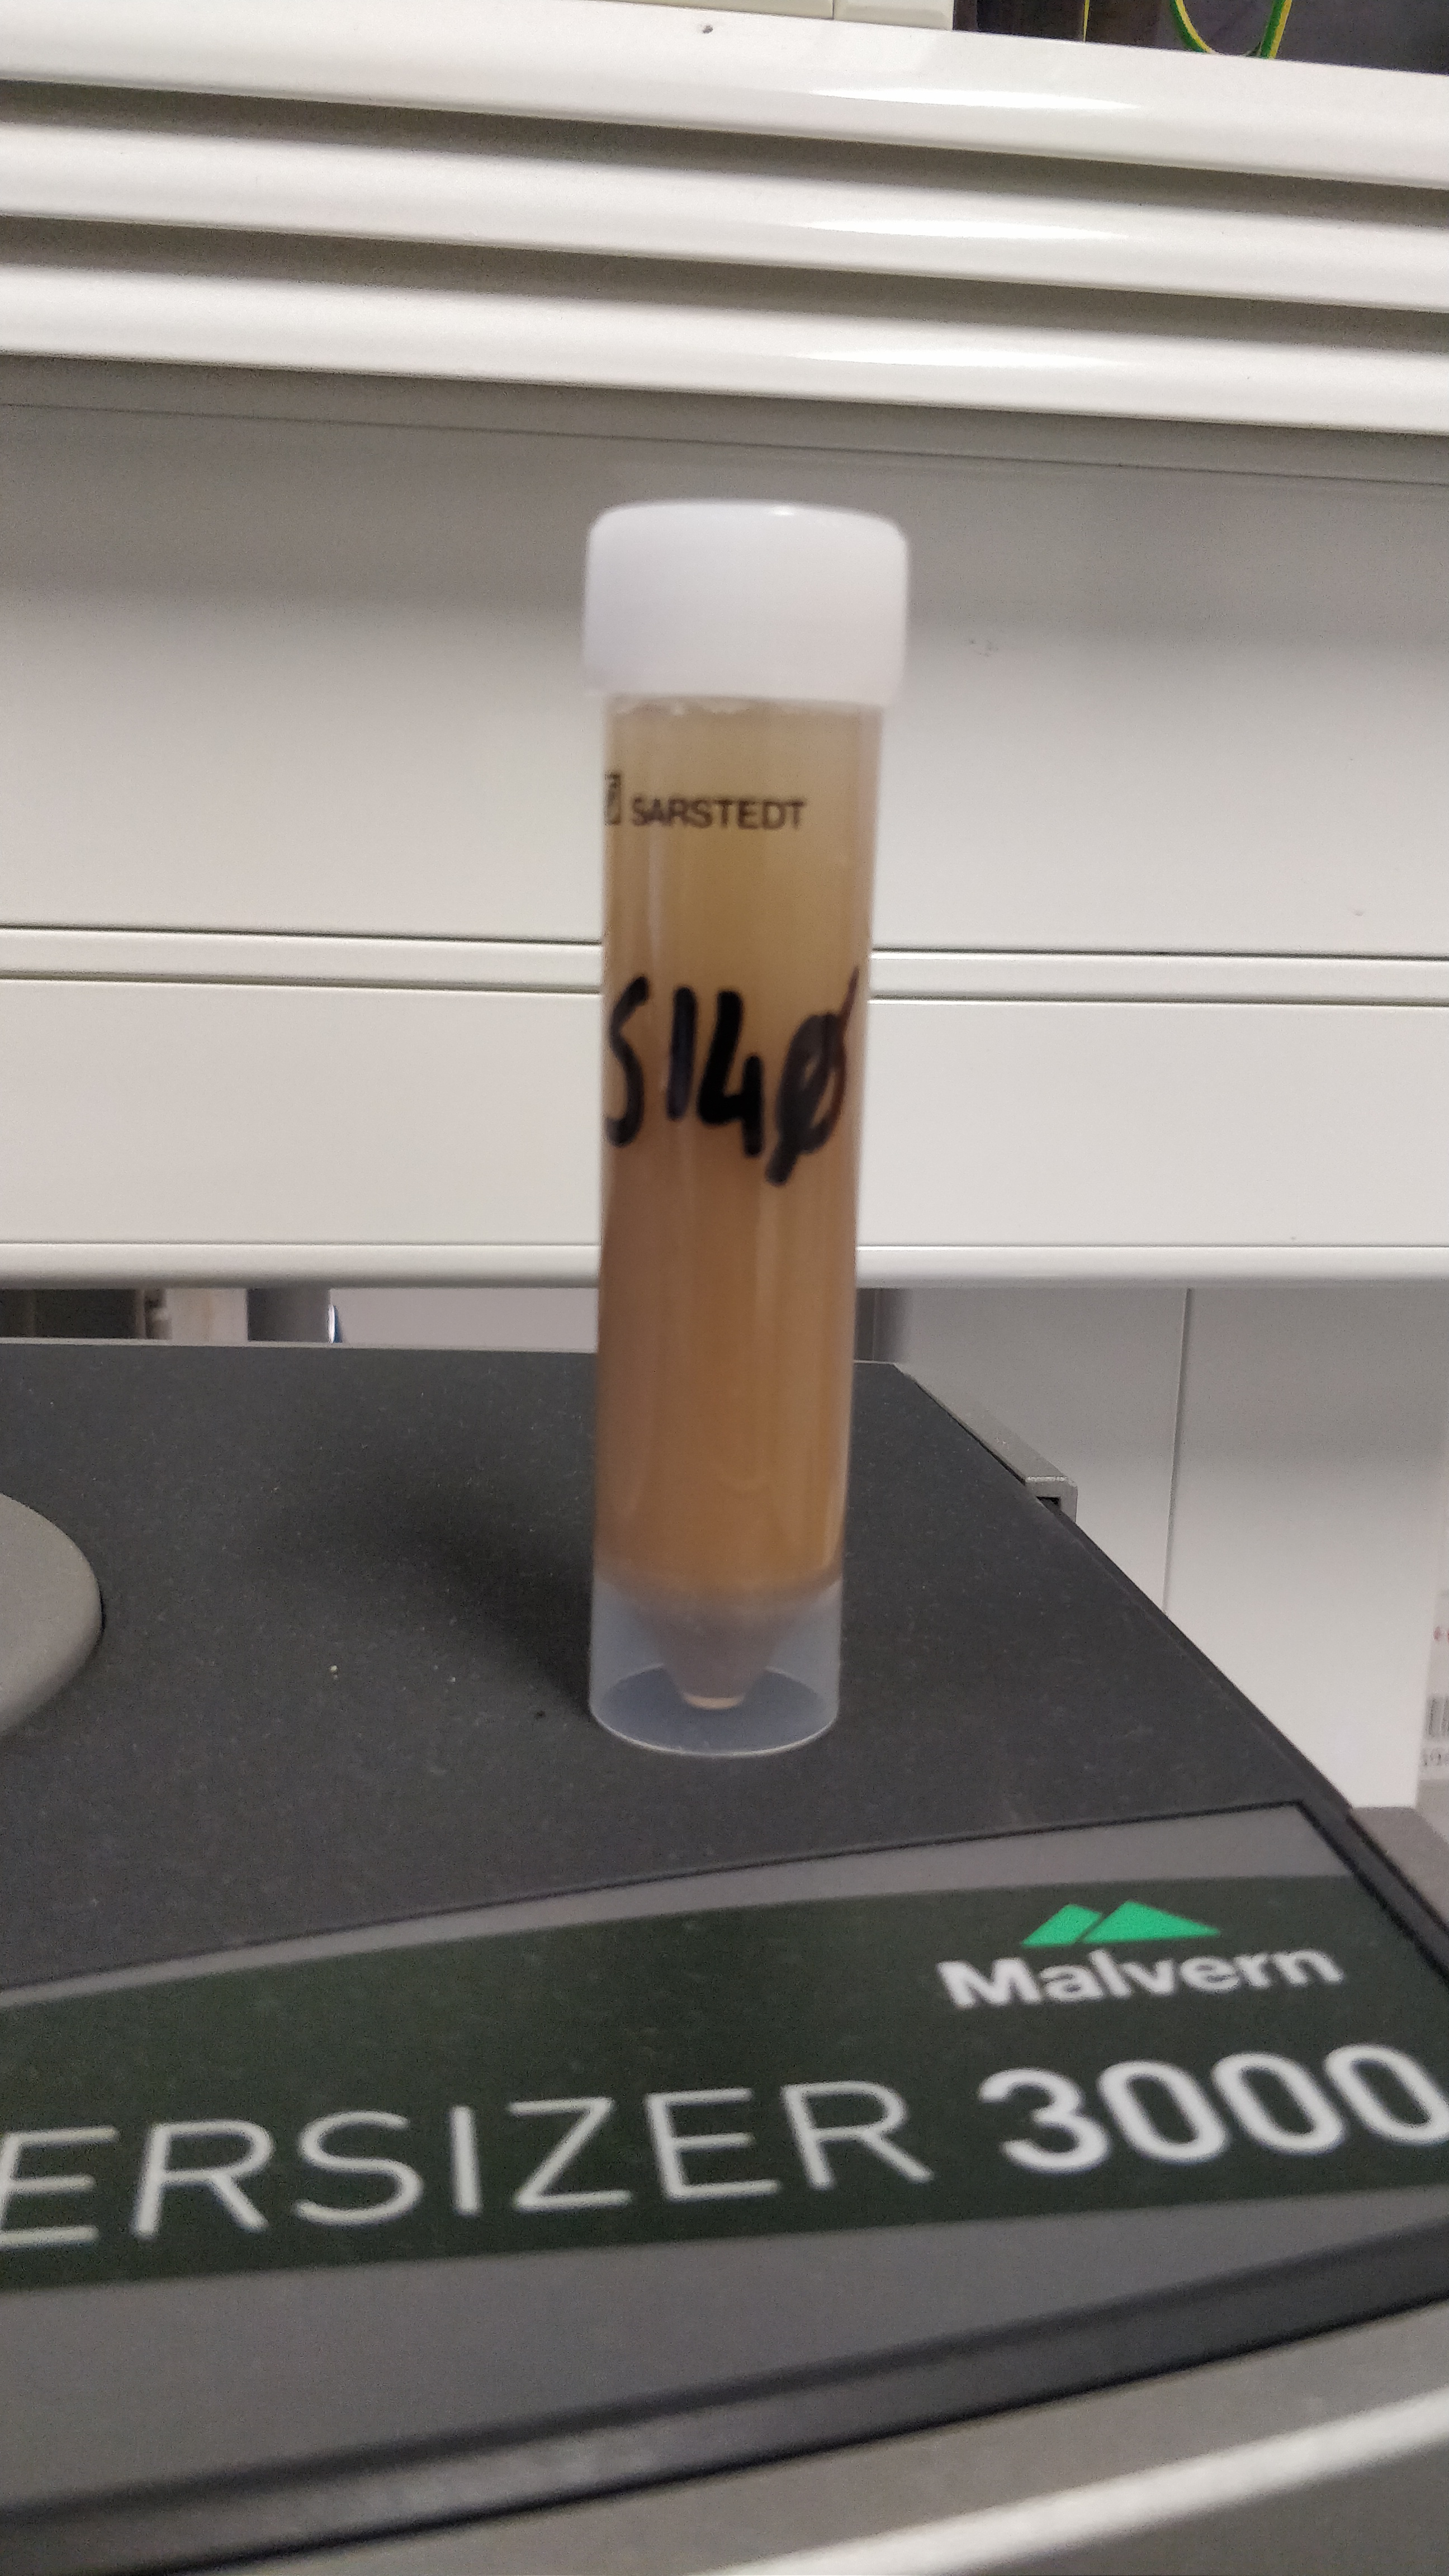
Fig 4: The sample after it has been sieved (2mm) in distilled water
The final step of the lab work, requires the use of a Malvern Mastersizer 3000, which has been recently acquired by the UCC Marine Geology Group (see http://marinegeology.ucc.ie/2018/06/28/our-new-malvern-mastersizer-3000-is-up-and-running/). This piece of kit is a really effective way of measuring grain size using a technique called of laser diffraction. What I do, is add my sieved sample into the unit (See Fig. 5), which is then passed through a chamber which uses internal detectors to accurately measure the intensity of light scattered by built in red and blue light sources.
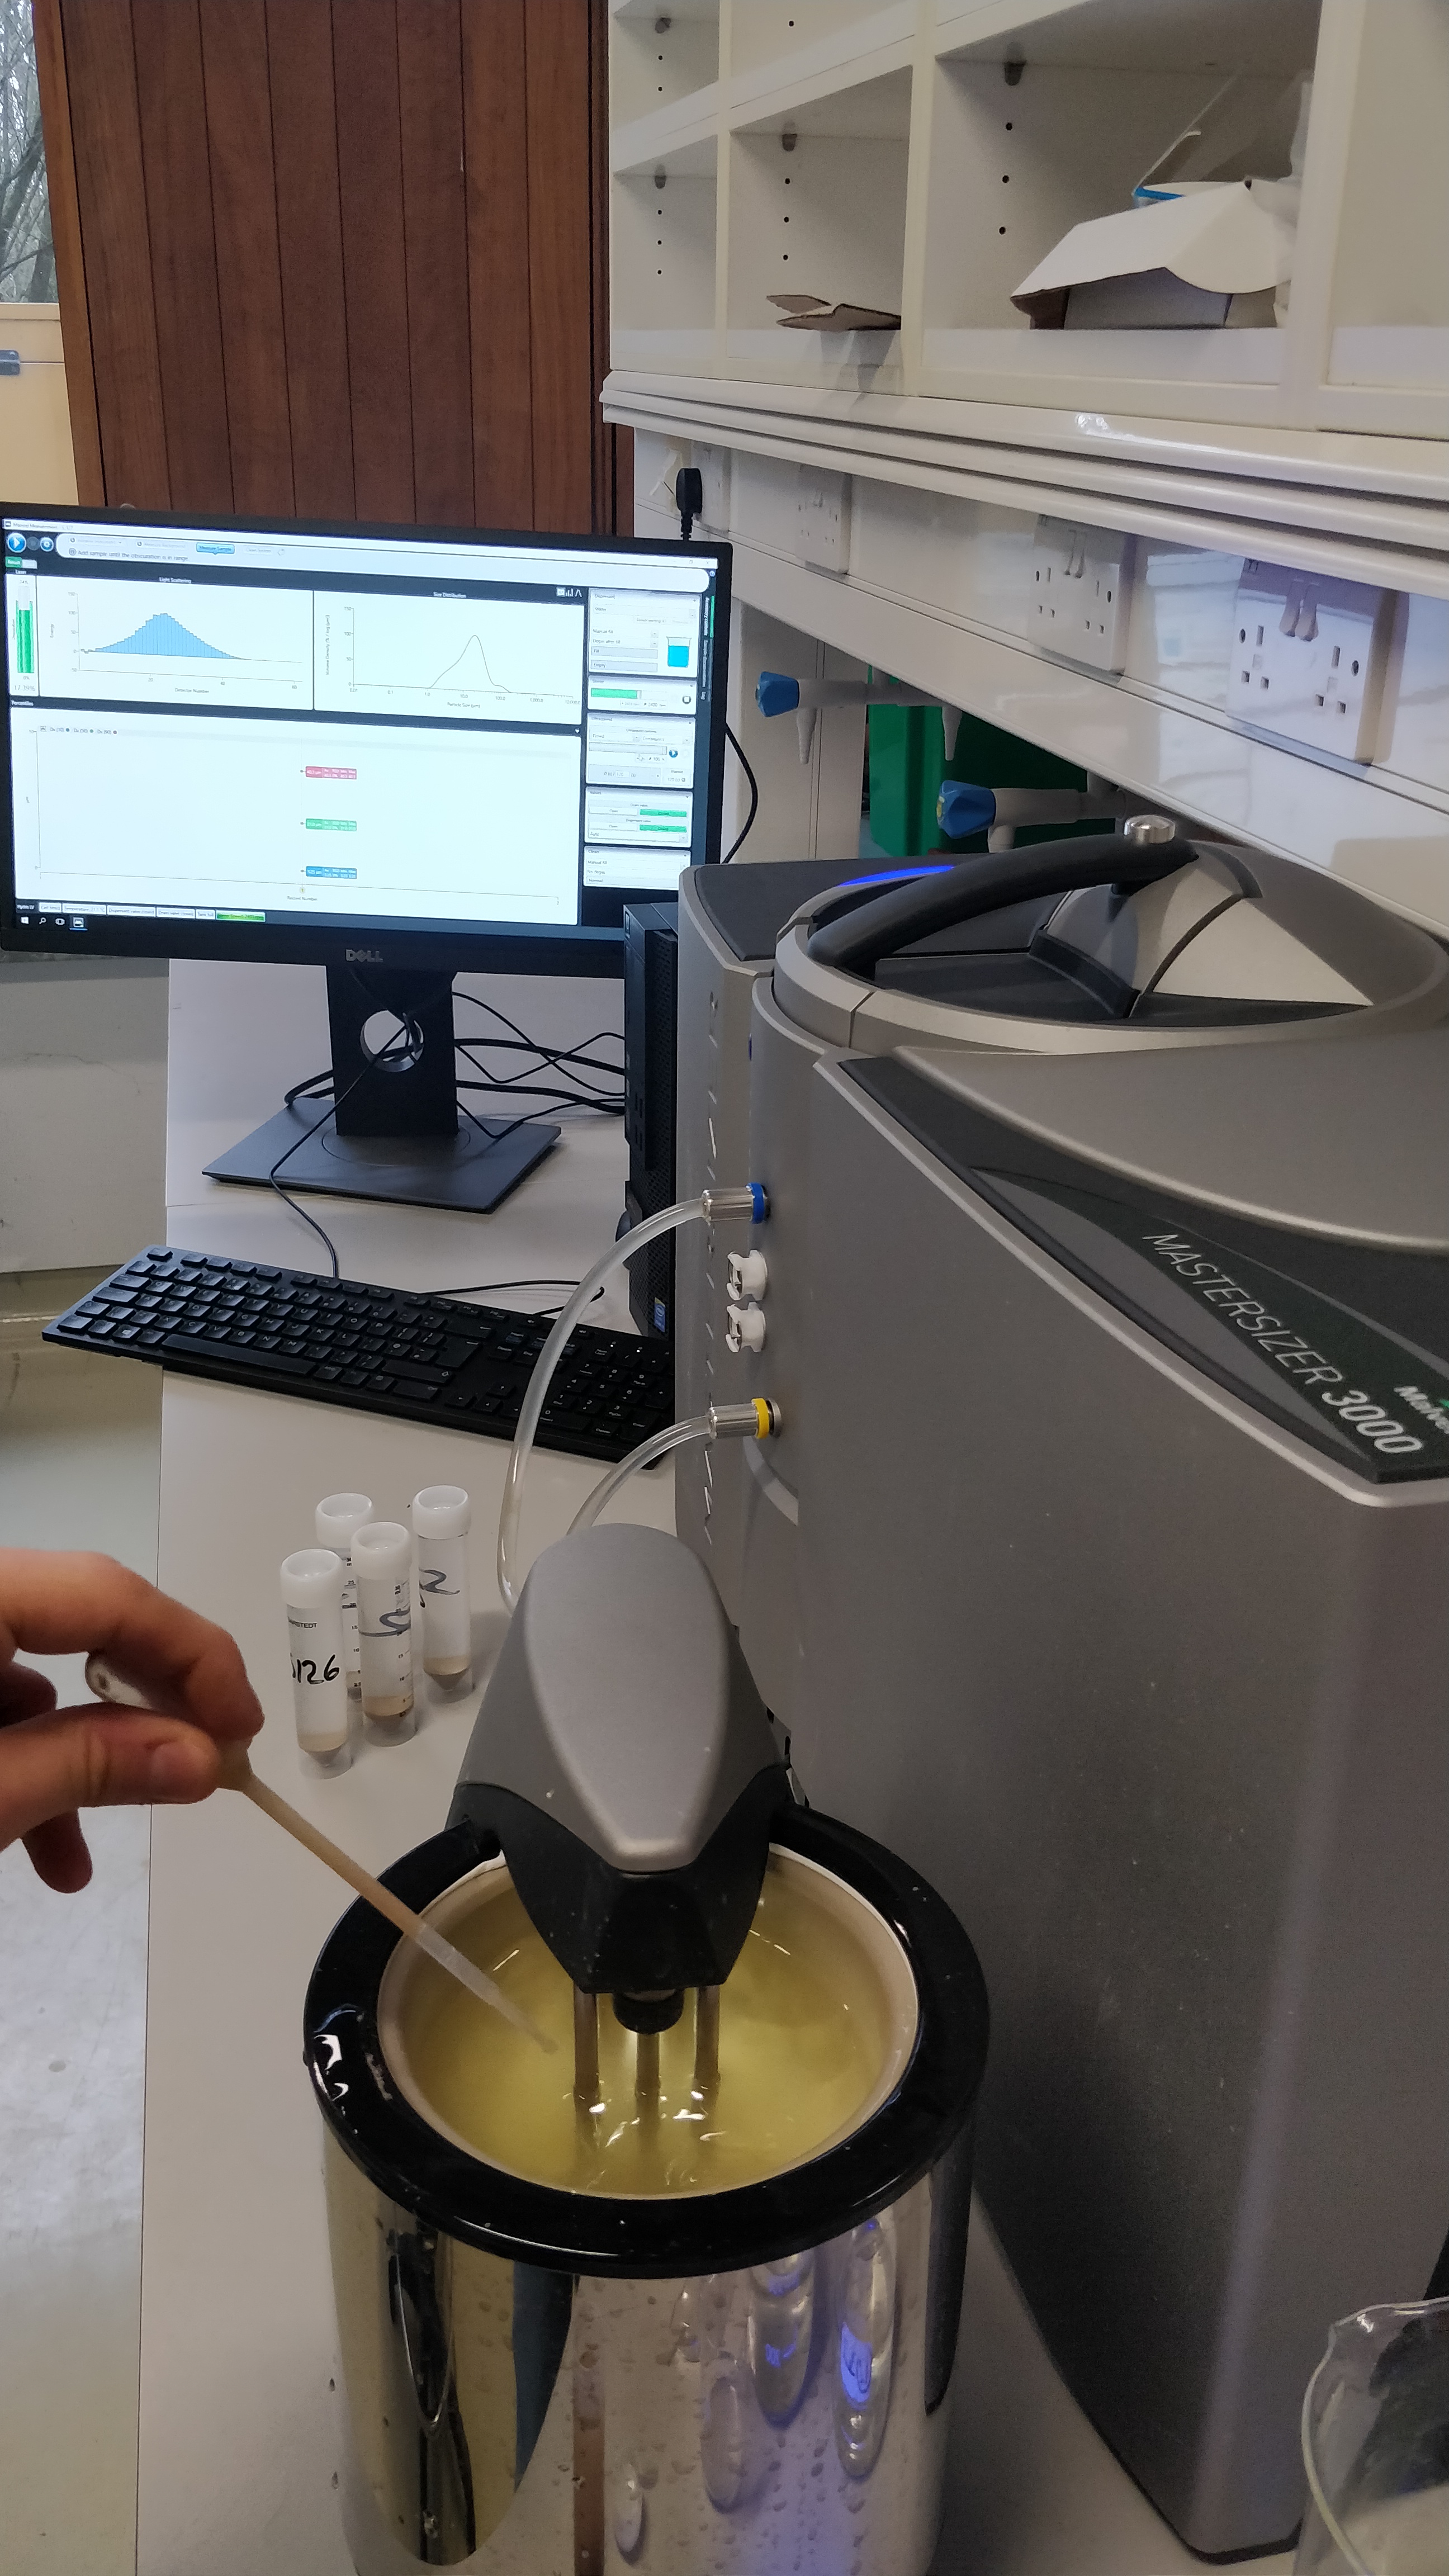
Fig 5: Mastersizer 3000 process
The Mastersizer then processes and analyses the scattering data to calculate the particle size distribution. The built in interface provides me with real-time information, and even assists me in improving my data quality! The data I will collect will then be used in conjunction with GRADISTAT, where I can extrapolate sortable silt values that can be used to calculate current speeds throughout the core. Anyway, Malvern have made this snazzy 4 minute video clip of how the unit works.. check it out!
https://www.youtube.com/watch?v=XAklcalCW-8.
By analysing the varying percentages of carbonate, organic matter and particle size throughout the length of my cores, this can give my team and I, a really good insight into how the PBC habitat has developed over time and help answer some really important research questions.
I hope to accumulate the data I have obtained from this lab work with my CT-derived heatmaps, which, in doing so, will help me determine areas of particular interest in my cores. Over the next few months, I will interpret this data, and nail down a) where exactly I should sample my cores for foraminifera and b) where I should date individual coral pieces using radiometric dating. This will further elude to habitat characteristics across the canyon and give a timeline to everything, respectively!
But first, I have to wrap up my current lab work, which at the time of writing this blog entry, is less than 1 m of total core length to go.
Marine Geosciences Research Group
University College Cork
Contact us
School of Biological, Earth and Environmental Sciences, North Mall Campus, University College Cork, North Mall, Cork City, T23 TK30