3D Modelling with Dr Aaron Lim!
Dr. Aaron Lim uses imagery aquired from a Remotely Operated Vehicle to build 3D models of the seafloor and cold-water coral reefs
My name is Aaron Lim, a researcher from the MMMonKey_Pro project. Over the past few months, I’ve been creating high-resolution 3D models of various cold-water coral habitats from the Porcupine Bank Canyon. This uses a combination of high-resolution data (ROV navigation, ROV video footage and high-performance computers) to reconstruct deep water habitats. Essentially, it allows us to recreate this hard-to-reach parts of our planet back in our lab so we can better understand them, their structure and make-up. In the past, this type of habitat mapping was carried out in 2D on the Irish margin but took considerably more time and effort. Today, I’m going to give you a flavour of how we complete these 3D models.
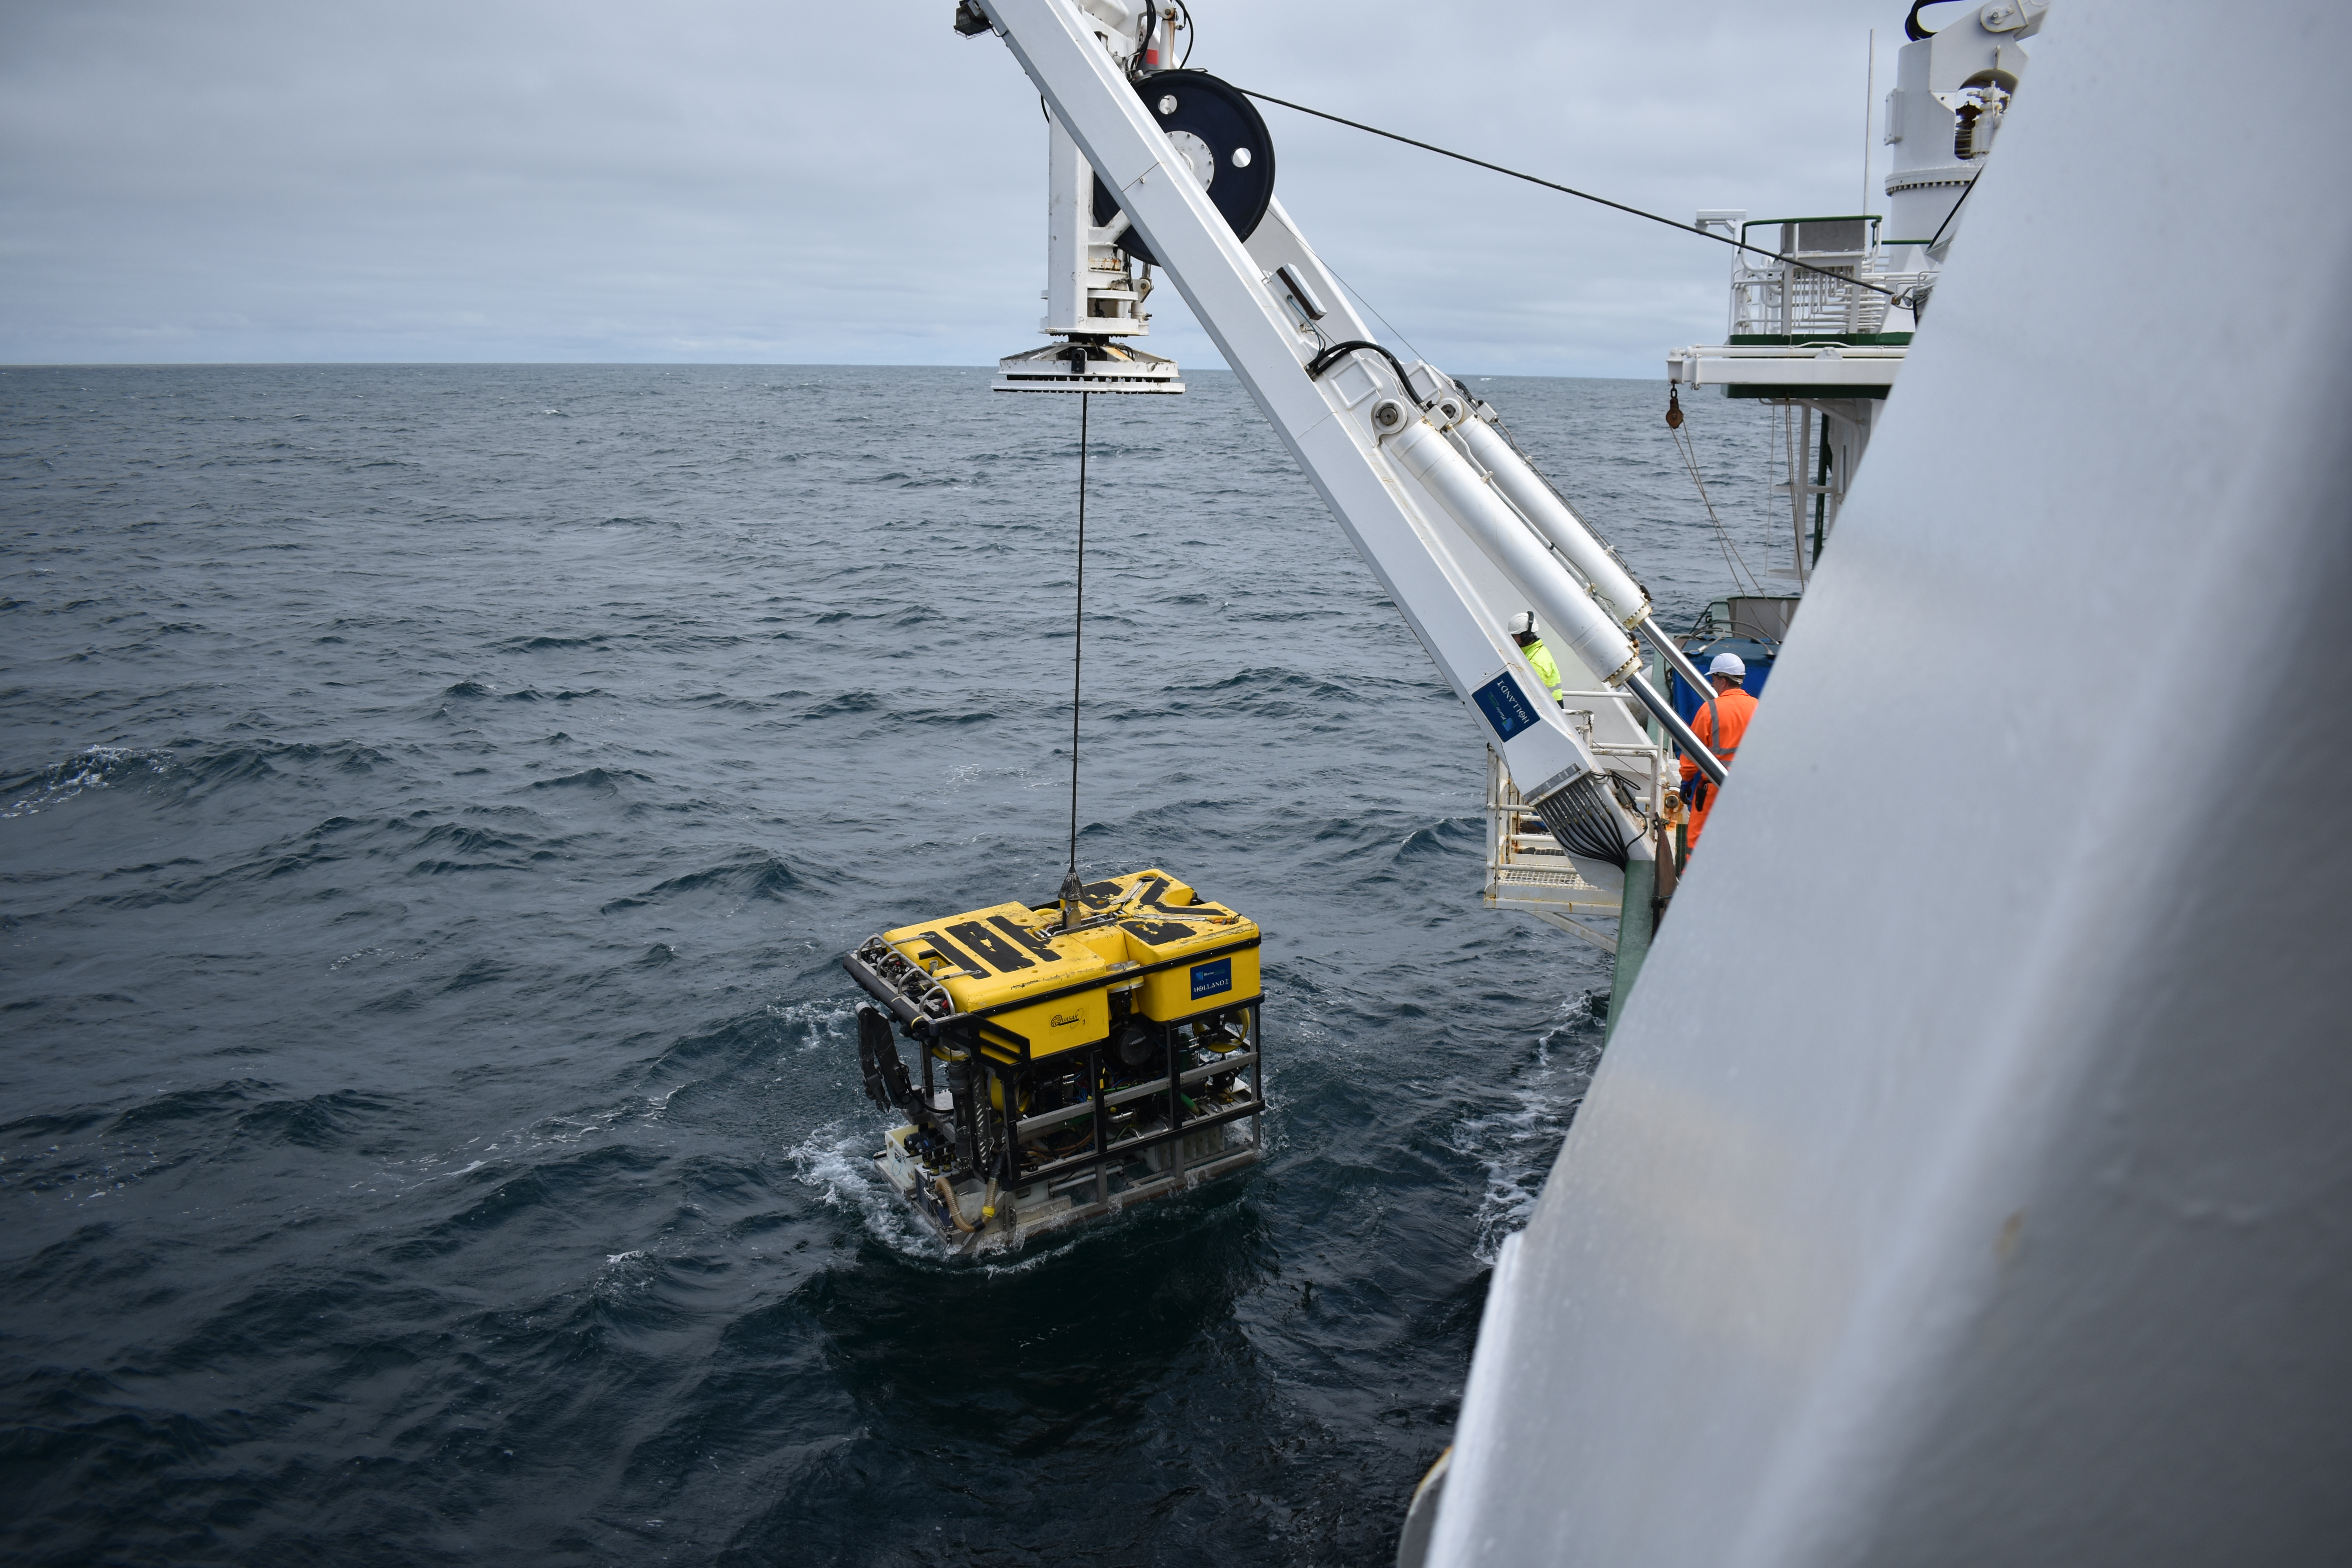
Fig 1: ROV Holland I being put in to the water[/caption]
First, we need to acquire the data to create the 3D models. To do this, we’ve deployed the Holland 1 ROV within the Porcupine Bank Canyon. Here, used a HD camera to collect continuous video footage across the habitats of interest. To do this, the ROV needs to move slow and steady. At the same time, the ROV is recording its latitude, longitude and depth which tell us where the ROV is. It also records its pitch, roll and yaw which tell us the angle that the camera is pointing while it is recording. Once we are happy with the recorded data, we recover the ROV back to the vessel where we make several backups of all the data.
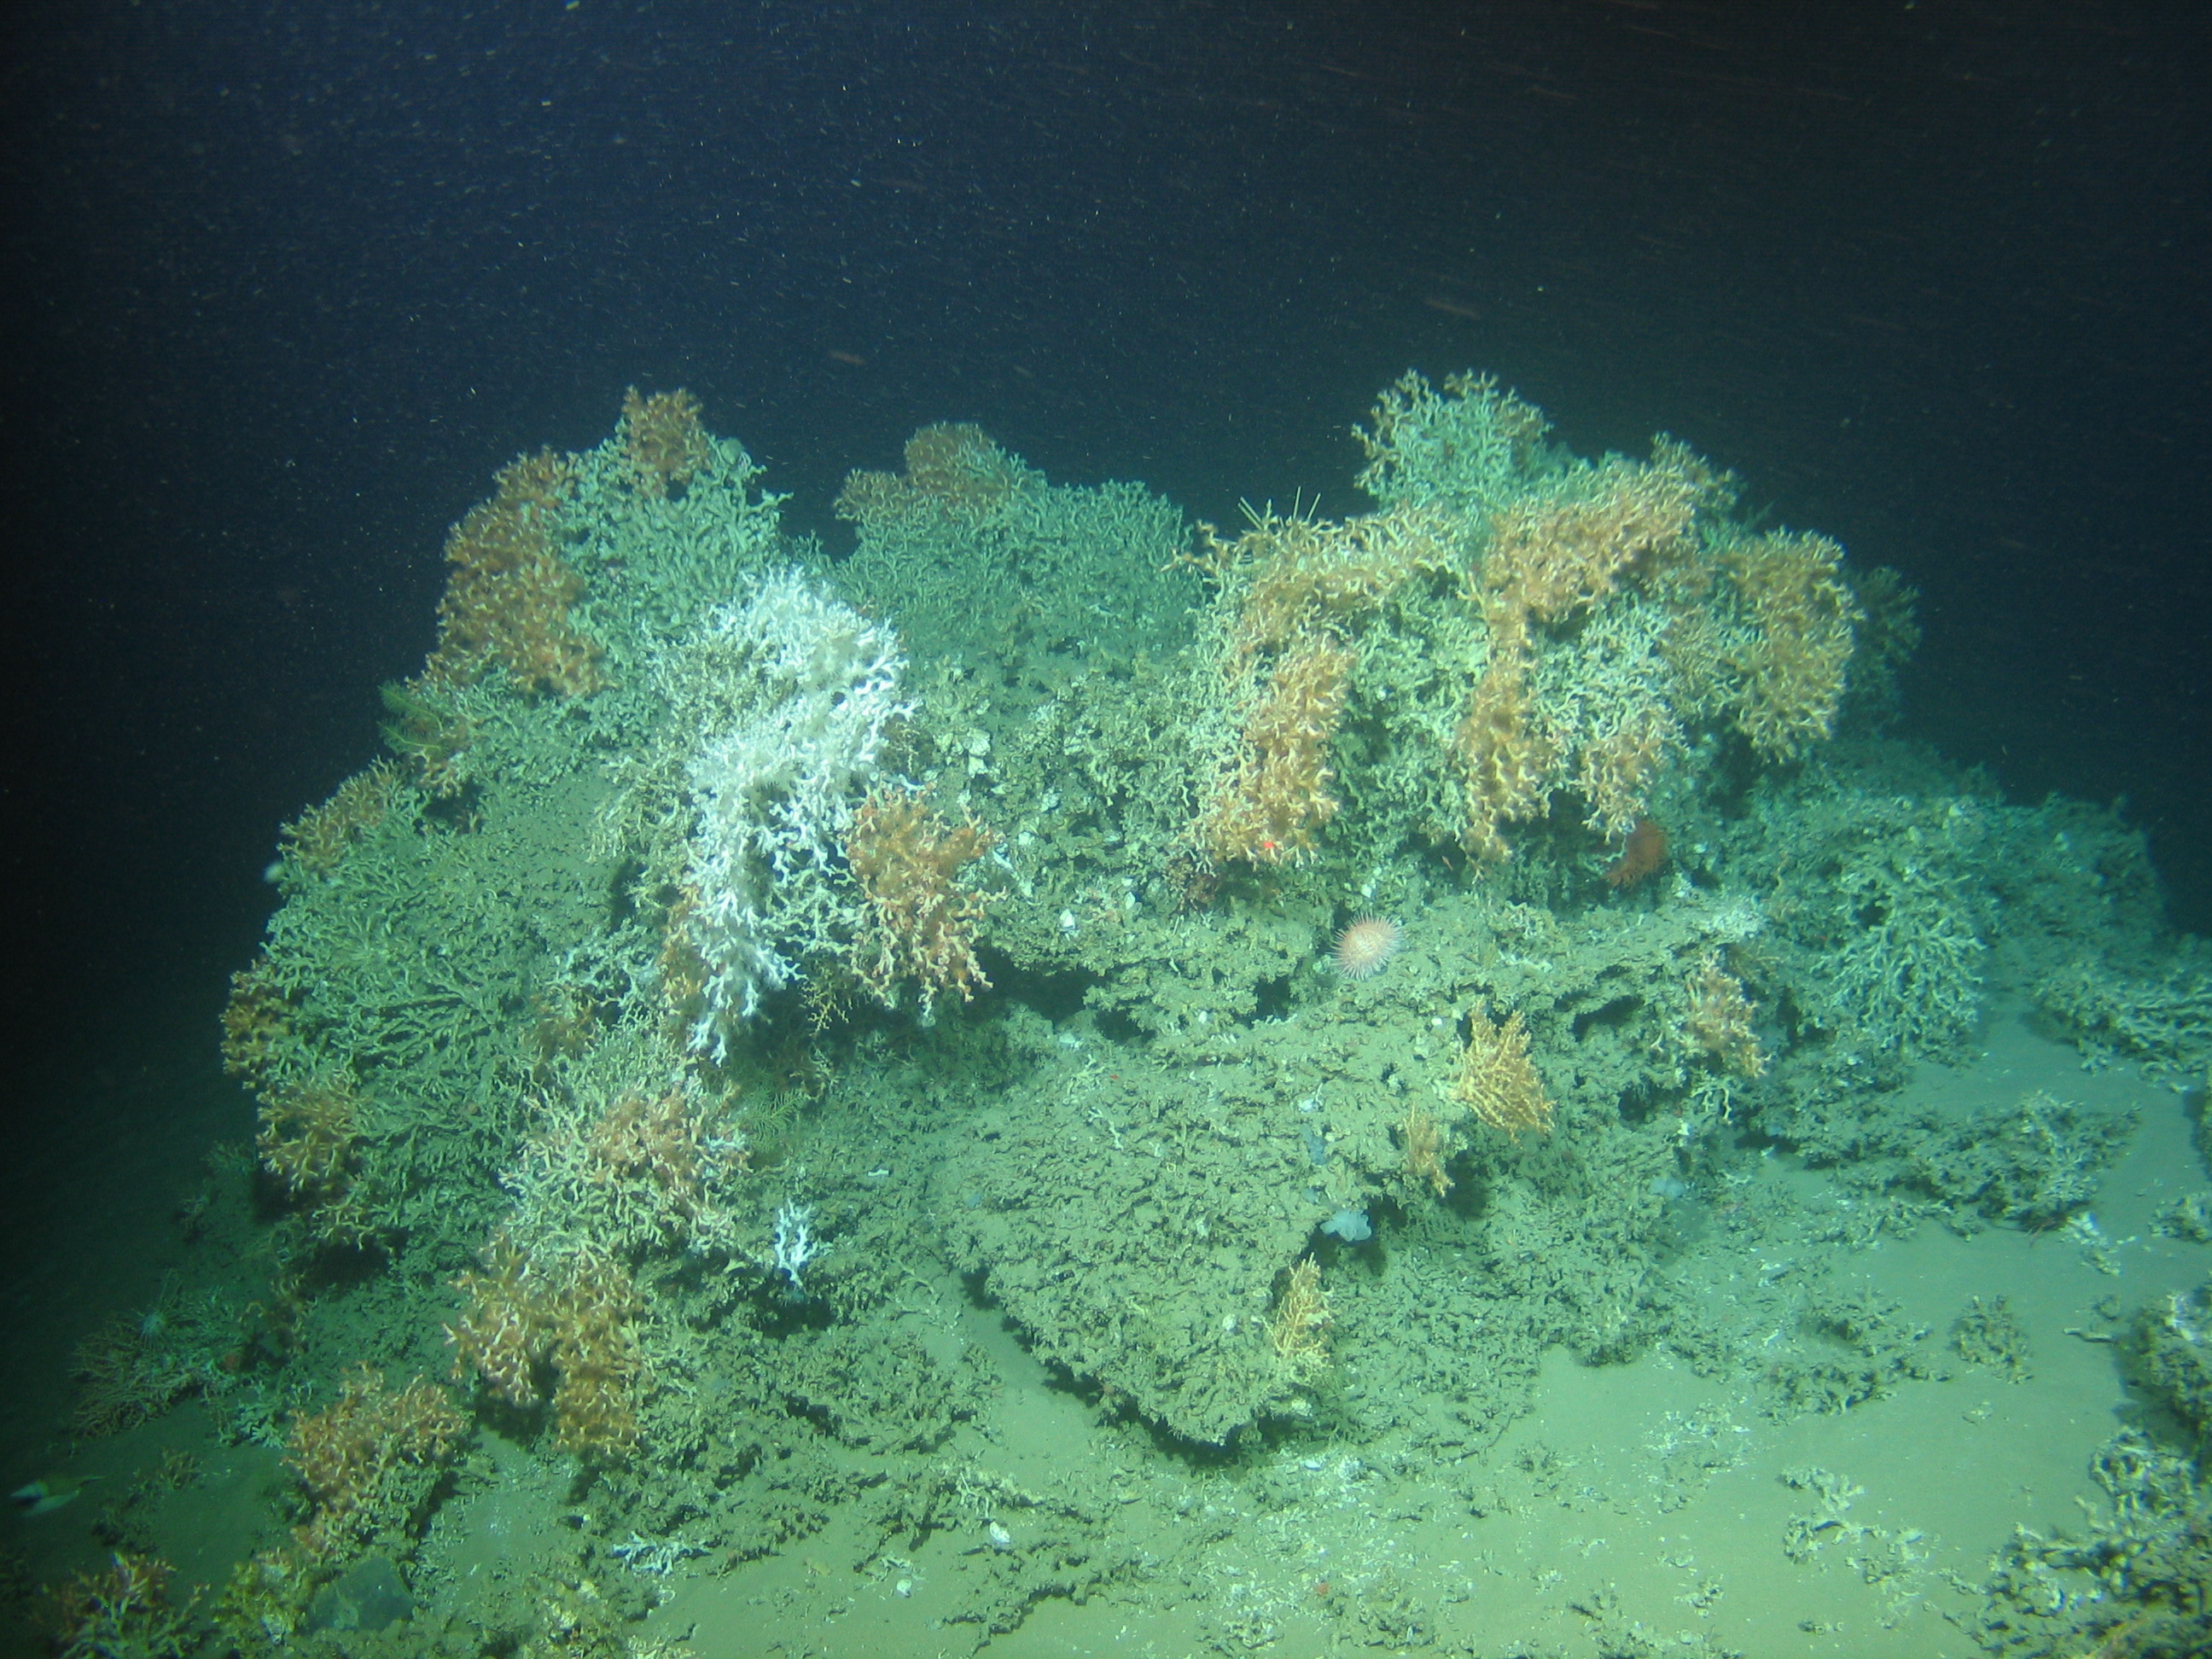
Fig 2: Image of deep-water coral habitat
Once we arrive back on land, we can start creating the 3D model. For this, the data needs to be “cleaned”, which means that all the data (video and navigation) that we do not need for the model are stripped from the file. The video is then broken into a series of individual frames. Each of these frames can be “stamped” with a unique navigation number that corresponds to the exact its latitude, longitude, depth pitch, roll and yaw of the camera at that time. This is called “geotagging”.
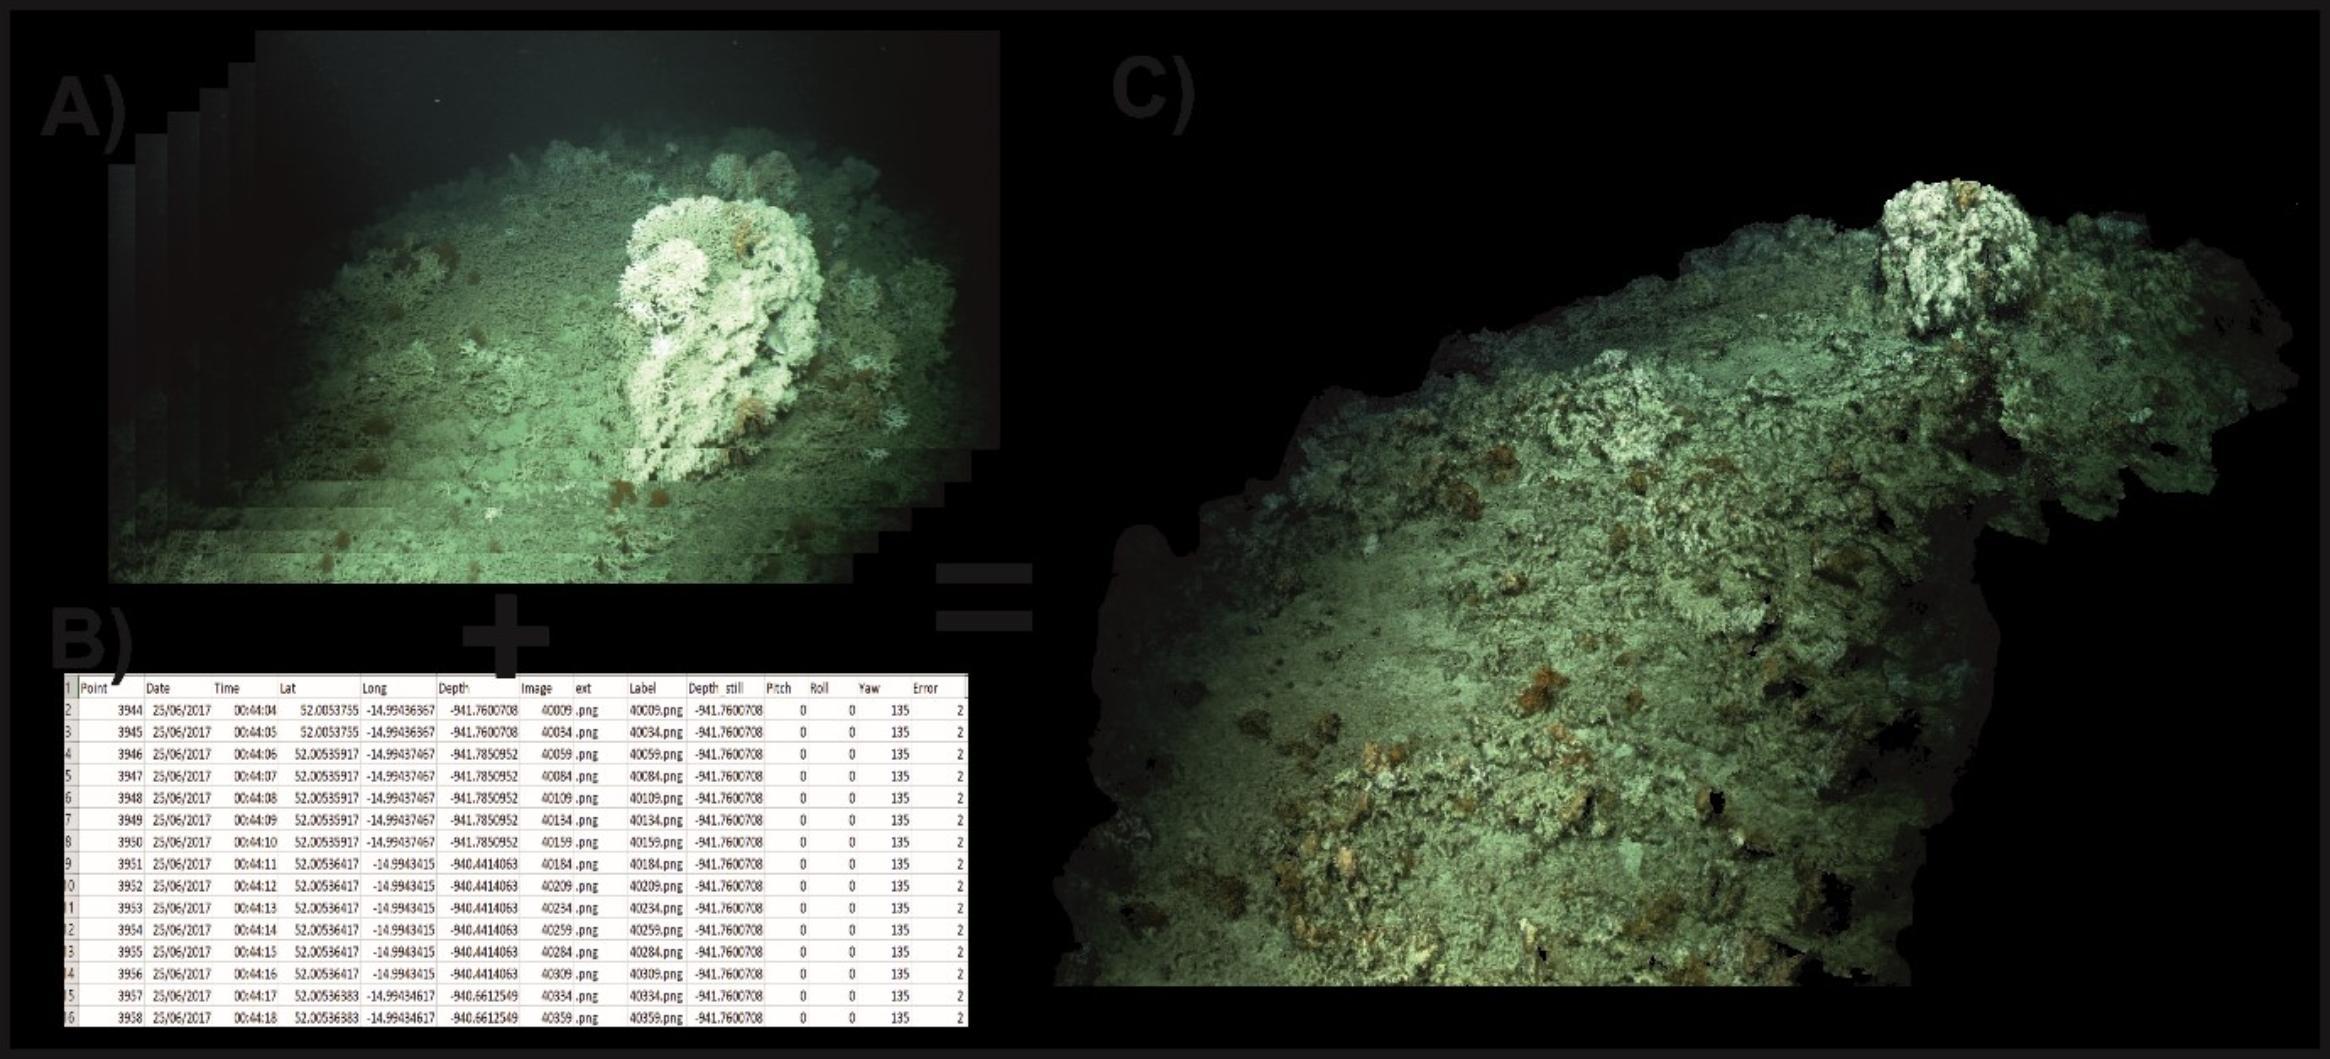
Fig 3: Schematic of the "geotagging" process
Each of these geotagged images are imported to a specialised software which examines each image and measures the difference between them. These differences are converted into distances and textures. Common points between these images are plotted as 3D (X, Y and Z) co-ordinates. This process allows to create a point cloud and eventually a 3D model. Bathymetry and Orthomosaics can be derived from this data.
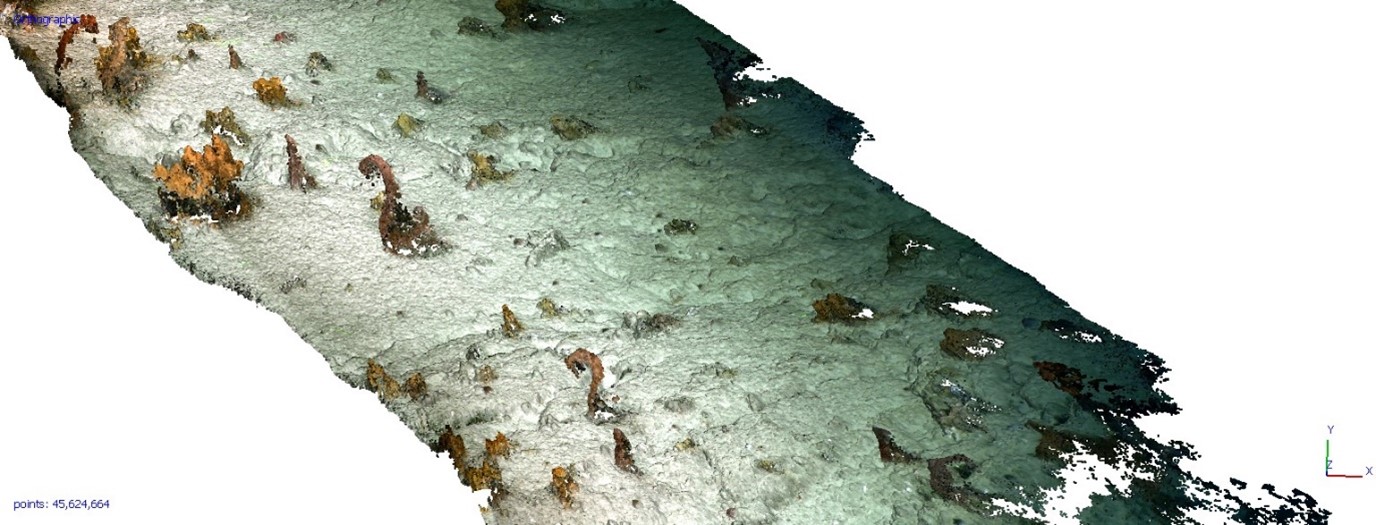
Fig 4: Point cloud from an early stage of the 3D model
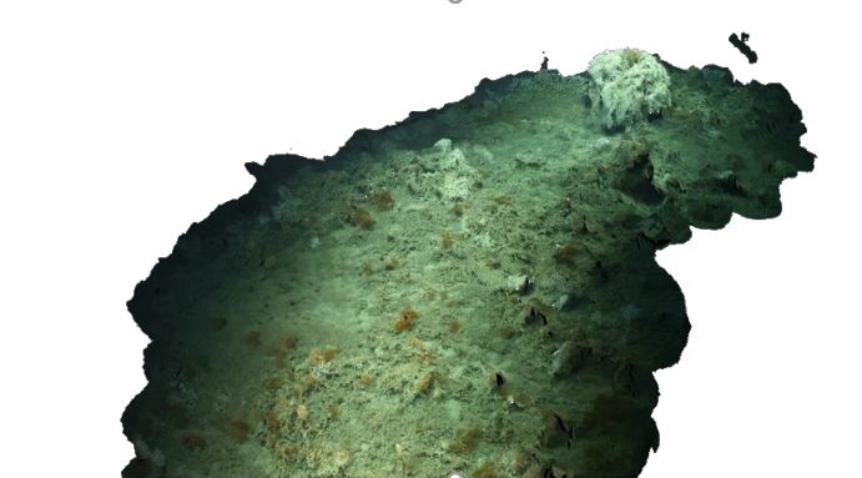
Fig 5: Completed 3D model
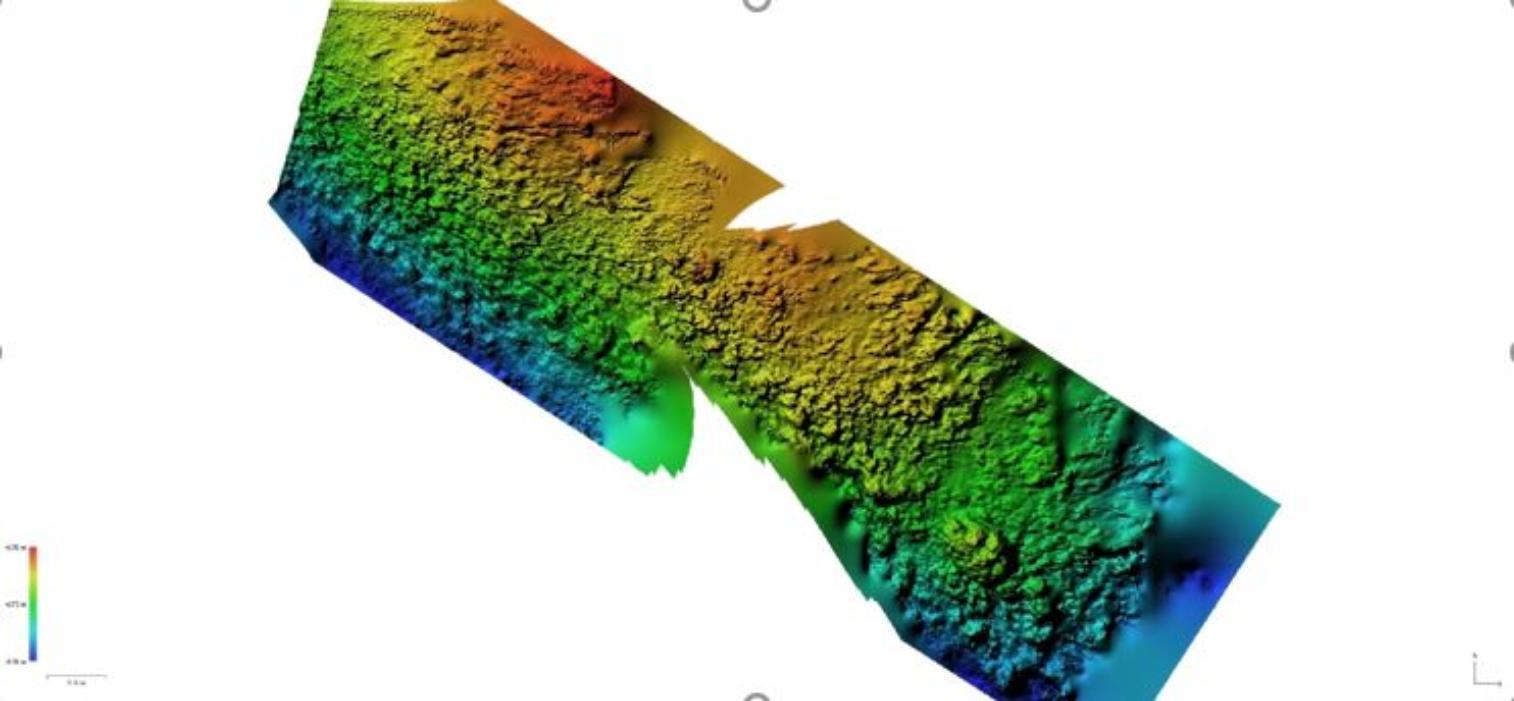
Fig 6: Bathymetry derived from the 3D model. Scale is approx. 2m swath
From these 3D models, we can use machine learning and object-based image analysis to calculate the composition and structure within these habitats. For the first time, this allows us to analyse the seabed using 1:1 (bathymetry: video) scale data within cold water coral habitats.
Marine Geosciences Research Group
University College Cork
Contact us
School of Biological, Earth and Environmental Sciences, North Mall Campus, University College Cork, North Mall, Cork City, T23 TK30