- CIRTL Homepage
- Meet our Team
- Resources
- Short Guides
- Short Guide 1: Starting Well
- Short Guide 2: Scaffolding Learning
- Short Guide 3: Icebreakers
- Short Guide 5: Discussions for Online Learning
- Short Guide 4: Visualising Thinking
- Short Guide 6: Universal Design for Learning
- Short Guide 7: Group Work
- Short Guide 8: Reimagining Practicals
- Short Guide 9: Assessment in the Age of AI
- Universal Design for Learning
- CIRTL Series
- Sustainable Development Goals Toolkit
- Learning Design Workshops
- Connected Curriculum
- Group Work
- Civic Engagement Toolkit
- Learning Outcomes
- DigiEd Reading List
- Ethical Use of GenAI Toolkit
- Short Guides
- Professional Development
- Research your Teaching
- Projects
- Events
- Office of the Vice President for Learning & Teaching
Visualization of networks science - VisNetSci
Visualization of networks science - VisNetSci

Explore this page
Project Lead
Dr. Philipp Hoevel, School of Mathematical Sciences
Project Team Members
Dr. Philipp Hoevel
3 student demonstrators (School of Mathematical Sciences):
- Nathaniel Volfango
- Ajeet Yadav
- Rory Humphries
The Teaching Challenge
The goal of this project is to create a pool of visualizations to promote the understanding of network science. This area of applied mathematics has recently seen a boost in both research and teaching. Unfortunately, mathematical theories are often challenging to understand. Similarly, many students struggle to obtain an intuition for empirical datasets.
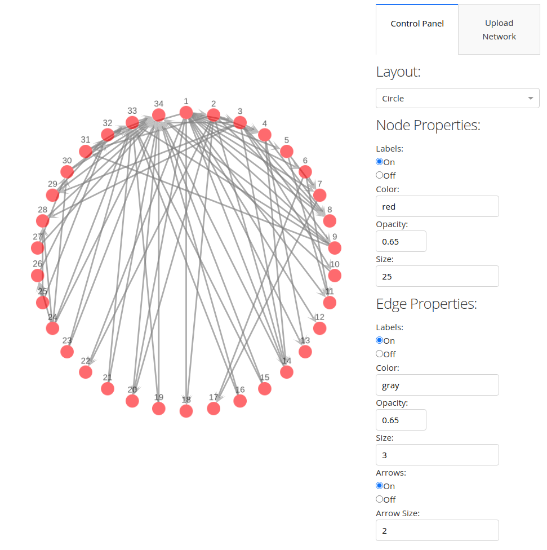
The visualizations that are developed within this project, illustrate theories and data sets in a graphical way. All material will be available online and can be easily included in lectures, summer schools, and public-outreach activities such as the mathematics enrichment circles and UCC open days. They also provide a visual basis for a better student understanding in periods of self-study. Therefore, the stakeholders range from experts in the field via students to interested laypersons.
The Project
The project started in late November 2019 and developed in two phases: (1) end of semester 1 and semester 2 of academic year 2019/2020 and (2) semester 2 of academic year 2020/2021. In both phases the student demonstrators and project lead met regularly to discuss the progress and to pinpoint the next steps.
During phase 1, the team created an overview of publicly available data sets and generic network classes that could potentially be used for the project. The team also explored technical details of programming such as a suitable programming language. First attempts were implemented using R and D3.
An intermediate milestone would have been the presentation at an international conference (e.g. International School and Conference on Network Science 2021). Unfortunately, the global SARS-CoV-2 pandemic led to the cancellation of relevant conferences.
Phase 2 was devoted to a renewed efforts to drive the project towards sharable outcomes. The team found it most useful to realize the visualizations via Python. Among others, we made use of the following Python modules: plotly (for plotting), dash (for creating a browser interface), pandas (for handling data structures), networkX (for network classes and data analysis).
Informal thought exchange took place with colleagues in Applied Mathematics and via international collaborations.
The Impact
Direct implementation in existing lectures allows the lecturer to discuss basic and advanced theories at a deeper and more intuitive level. The visualizations extend the lecturers e-teaching portfolio and strengthen a research-based teaching philosophy. At UCC, for example, the visualization are used and will be used in UG and PG modules such as AM4065 “Network Science: Theory and Applications” and AM6017 “Complex and Neural Networks”.
Visually appealing illustrations of mathematical theories and data sets promote the intuition and raise the engagement with the lecture material to a higher level. A deeper understanding of network science is very likely to enhance the students’ employability as this area of research is well sought by digital industries. The programming language Python is widely used in the education of mathematics and related disciplines as well as industry and private sector companies. This makes it an ideal tool for interested students to take a look behind the code.
VisNetSci has a strong potential to scale up to a larger endeavor via future calls, which will further contribute to its sustainability and long-term impact. It can be seen as seed funding to showcase an idea in one specific area (network science) that can be extended to other topics.
The project is directly linked to UCC’s framework of a Connected University via pillar 1 “Learning and Teaching” (e.g. 1.1 Unique, Individualised and Connected Learning) and pillar 3 “Student Success” (e.g. 3.1 Student Experience). It also touches upon pillar 3 “Research and Innovation” as it allows to bring state-of-the-art science to the classroom.
For more information
Visit the project website: https://www.ucc.ie/en/matsci/outreach/visnetsci/
Media
Exemplary visualization of a dataset (here: Zakachary Karate Club Network)
