In This Section
- Home
- About
- Student Led
- Research Informed
- Practice Focused
- Resources
- Case Studies
- Green Labs Community
- News
- Office of Sustainability and Climate Action
UCC Electrical & Gas Performance Academic Year 2019/20

Needless to say the closing of the campus in March 2020 due to the COVID pandemic had a big impact on our energy performance for the Academic year 2019/20. Our weekly electrical consumption reduced by 40% while our natural gas consumption, used to heat our buildings, reduced by over 50%.
By the end of the academic year the University reported that the total energy load reduced by 11%, when compared to the 2018/19 academic year.
| Scope | 2018/19 | 2019/20 | % change 18/19 |
|---|---|---|---|
| Electric GWh | 19.98 | 17.1 | -15% |
| Gas GWh (normalised) | 21.9 | 19.98 | -9% |
2019/20 Electrical Performance Summary
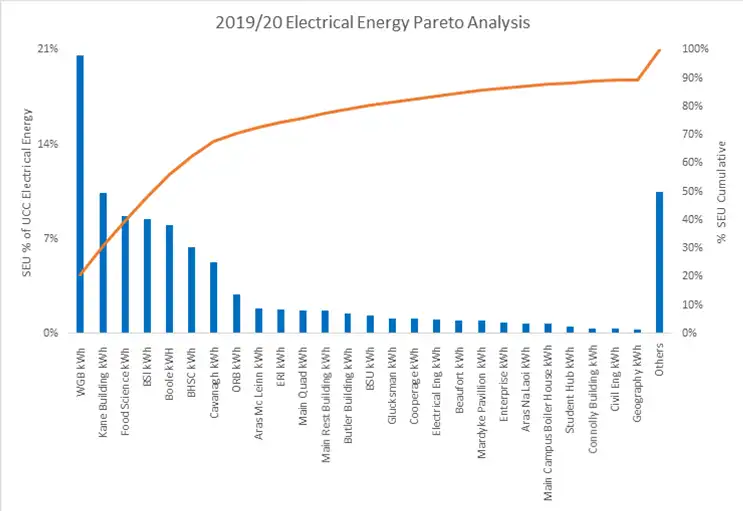
By the end of the academic year it was determined that 26 buildings accounted for 90% of the Universities electrical load with the WGB building by far our largest significant energy user (SEU).
The graph below shows where the electricity is consumed across UCC’s estate. The electrical consumption of each building is monitored on a weekly basis, ensuring that any slippage in our energy conservation plans within those buildings are picked up quickly and investigated. The account listed as ‘Others’ is made up of a large number of small buildings such as houses and rental properties.

Figure 1. Significant electrical energy users across our estate.
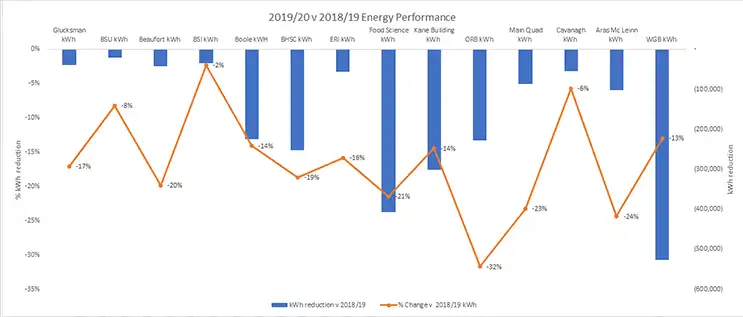
Pre COVID closure the University was on track to exceed its 1% energy reduction target by an additional 0.5%, despite the opening of the Student hub in January 2020. Like most of the population, once we got over the initial shock of the campus closure the Estates department quickly set about optimising our building services to reduce energy consumption while at the same time supplying sufficient heat and ventilation to keep the fabric of our buildings protected. As critical research activities returned later in the year the Estates department worked closely with the building occupants to ensure that the building services time schedules met the needs of the occupants, while at the same time minimising energy wastage due to lower building occupancy. The weekly reductions achieved across the Estate were heavily influence by the building use. Research intensive buildings such as the Cavanagh or WGB only achieved reductions of a 20-25% in their weekly energy load as the research equipment had to continue running along with the services required to support the research areas. Meanwhile the traditional office-based buildings such as the Quad or ORB reported a 75% drop in their weekly energy consumption. Figure 2 shows the total reductions per SEU when compared to 2018/19 period which ranged from a reduction of 2% in the BSI to 32% in the ORB.

Figure 2 Significant Energy User 2019/20 performance v 2018/19.
2019/20 Natural Gas Performance Summary
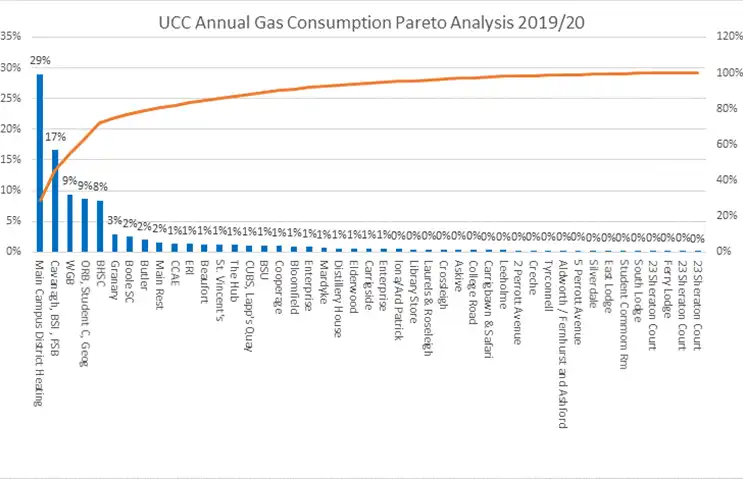
Used as the fuel for our heating systems, natural gas consumption is heavily influenced by the external conditions, building occupancy levels and opening times. Our main heating systems typically run from October to April while a number of systems run year-round to supply hot water and conditioned air for research areas that require close environmental control, i.e. cleanrooms. Through regression analysis and metering we are able to actively predict the gas consumption patterns of 13 buildings that account for 82% of our annual gas consumption.
The graph below shows where the majority of gas is consumed across UCC’s estate. The weekly gas consumption is compared with the predicted gas consumption, based on the external temperature and heating degree days and any unexplained increases in gas use is investigated to determine the cause and where needed, put a fix in place to prevent further energy wastage.

Figure 3 Significant gas users across our estate.
While the majority of the buildings were closed in March the heating systems still had to run , albeit for a shorter time period, to provide fabric protection as well as minimising the risk of legionella in the domestic hot water systems. By April, as the restrictions became clearer and the external temperatures improved the majority of our heating systems were reduced to operating for 2 hours per day.
2020/21 Energy Predictions
19 energy projects are planned for 2020/21, ranging from lighting controls upgrades to the installation of an air source heat pump in the ORB. If successfully implemented we are forecasting a 5% reduction in our total energy use for 2020/21, when compared to 2018/19. The obvious caveat to this forecast is the ongoing impact of the COVID risk reduction measures and building opening times. Good ventilation has been identified as a key mitigation tool in reducing the risk of aerosol transmission of the virus and as a result our ventilation systems are running on full fresh air for 2 hours before, during and 2 hours after the building opening times. Based on the best available data this has the potential to increase our electrical consumption by 5-25% and our gas consumption by 50-100%, wiping away the last decade of energy savings. Working closely with our staff and students, the Estates office is closely monitoring our daily energy consumption and building utilisation to see if the impact of the increased ventilation loads can be reduced.
For more on this story contact:
For further information on our energy performance or if you have any comments / suggestions please email our Energy Manager at p.mehigan@ucc.ie
Green Campus
Contact us
University College Cork, College Road, Cork T12 YN60,
- greencampus@ucc.ie
- Dr Maria Kirrane, Sustainability Officer - m.kirrane@ucc.ie
