In This Section
Meteorological factors involved in the genesis of the 2012/2013 fodder crisis
This post contains part of the work performed by Robyn Dennehy during her SEFS (College of Science, Engineering and Food Science) undergraduate summer bursary, under the supervision of Dr. Lucía Hermida González and Dr. Paul Leahy.
Introduction
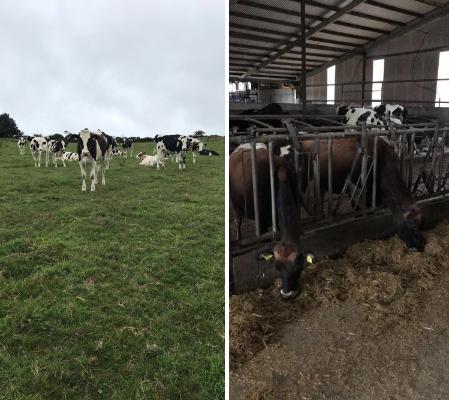
The fodder crisis of 2012/2013 had massive impacts on the Irish agricultural sector and affected most farmers, particularly in the midlands, south and southwest of the country. Many farmers struggled to gain access to fodder resulting in increased animal deaths and decreased farm output (Figure 1).
Fodder crises are not uncommon in Ireland with one occurring in 1998/1999 and most recently as 2018. A deeper understanding of these fodder crises is needed to assist farmers in farm planning and mitigating the effects of reduced output. A step towards this is the analysis of the meteorological factors involved in the genesis of such crises.
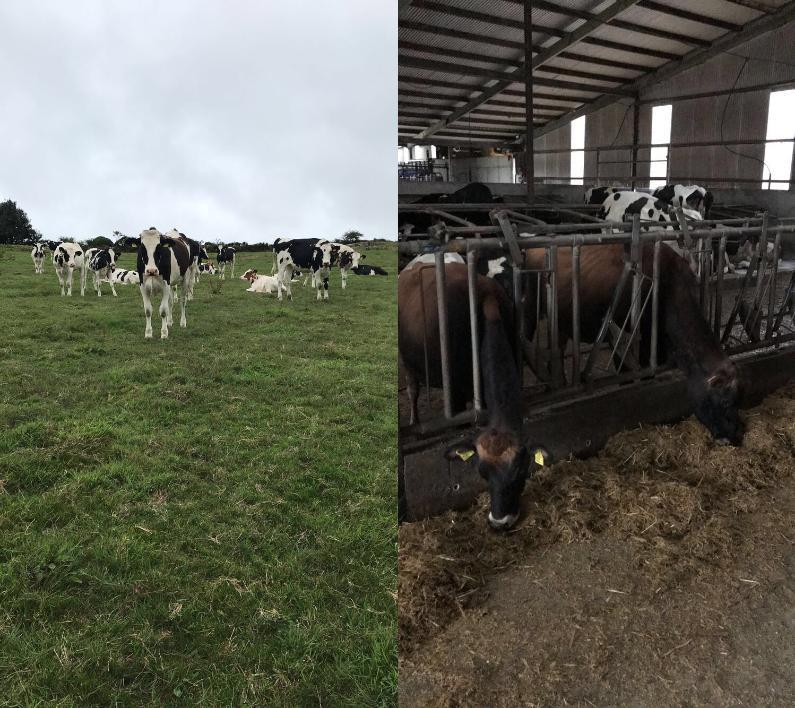
Figure 1. Dairy cows on a farm in Clonakilty, Cork. Picture courtesy of Dr. Greg Beechinor.
Concentrated feed and fodder prices increased significantly through 2012 and into 2013, due to the lack of grass growth, which in turn led to the early slaughtering of 23,000 extra livestock, particularly from beef farming (Agriland.ie, 2013). Some long-term effects of such a fodder crisis on farms include soil damage and decreased fertility of the livestock. Even though some of the losses incurred were offset by increased dairy prices in 2013, the official cost of the fodder crisis to the farming community was estimated at €500 million (Agriland.ie, 2013).
Meteorological Conditions and Grass Growth
Meteorological conditions are critical to grass growth in Ireland. Particularly so because 81% of Ireland’s agricultural land is used for pasture, hay and grass silage (European Commission-Ireland, 2018). As is common in temperate climates, Ireland’s dominant grass species is perennial ryegrass. Different authors have already explained how factors including solar radiation, temperature and rainfall affect the rate of grass growth (e.g.: Hurtado-Uria et al., 2013; Brereton et al., 1996).
1.Temperature
Temperature affects photosynthesis, respiration, spring growth and senescence of grass (Hurtado-Uria et al., 2013). Temperature varies by season and by location based on latitude, longitude and altitude. In north-west Europe, winter temperatures tend to vary in a west-east direction due to the isotherms being positioned in a north-south direction (Brereton et al., 1996). Conversely, in summer, temperatures tend to vary in a north-south direction due to the isotherms lying west-east. Temperature also decreases with height at a rate of approximately 0.6°C per 100m rise in altitude (Brereton et al., 1996). In Ireland, perennial ryegrass does not grow until temperatures exceed 5°C (Hurtado-Uria et al., 2013; Brereton et al., 1996). Winter temperatures average between 4°C and 7°C, while summer temperatures average between 14°C and 18°C. Therefore, in winter months, little to no grass growth occurs. Temperature tends to vary from west to east but also from coast to further inland in Ireland. This causes spring growth of grass to begin at different times of the year depending on location within the country. The length of the growing season in coastal areas of the south of Ireland is approximately 340 days, in comparison to northern inland locations where it is approximately 240 days (Connaughton, 1973).
2.Rainfall
Rainfall determines the soil moisture and thus the rate of growth of grass (Brereton et al., 1996). Plants require water in the soil to grow and to carry out the processes of evapotranspiration and nutrient uptake (Hurtado-Uria et al, 2013). Available moisture in the soil depends on the soil type which determines that rainfall is retained differently. Rainfall is particularly important to maintain soil moisture in summer months and in areas prone to drought (Hurtado-Uria et al., 2013).
Data and methodology
We examined the meteorological factors that determined the poor growing season in 2012 and that triggered the severe fodder crisis of 2012/2013. In order to do so, we obtained daily minimum air temperature (limiting for grass growth) and daily rainfall data from Met Éireann.
Five locations across Ireland were chosen to be used in this analysis: Cork Airport in Co. Cork, Mallow (Hazelwood) in Co. Cork, Shannon Airport in Co. Clare, Newport (Furnace) in Co. Mayo and Mullingar in Co. Westmeath (Figure 2). The stations were selected to reflect different regions of the country and provide an overview of the representative conditions seen nationwide in 2012. No air temperature data were available for analysis at Mallow Hazelwood. The daily data were converted into annual and weekly data. When possible two different long-term averages (LTA) were considered: 1961-1990 and 1981-2010.
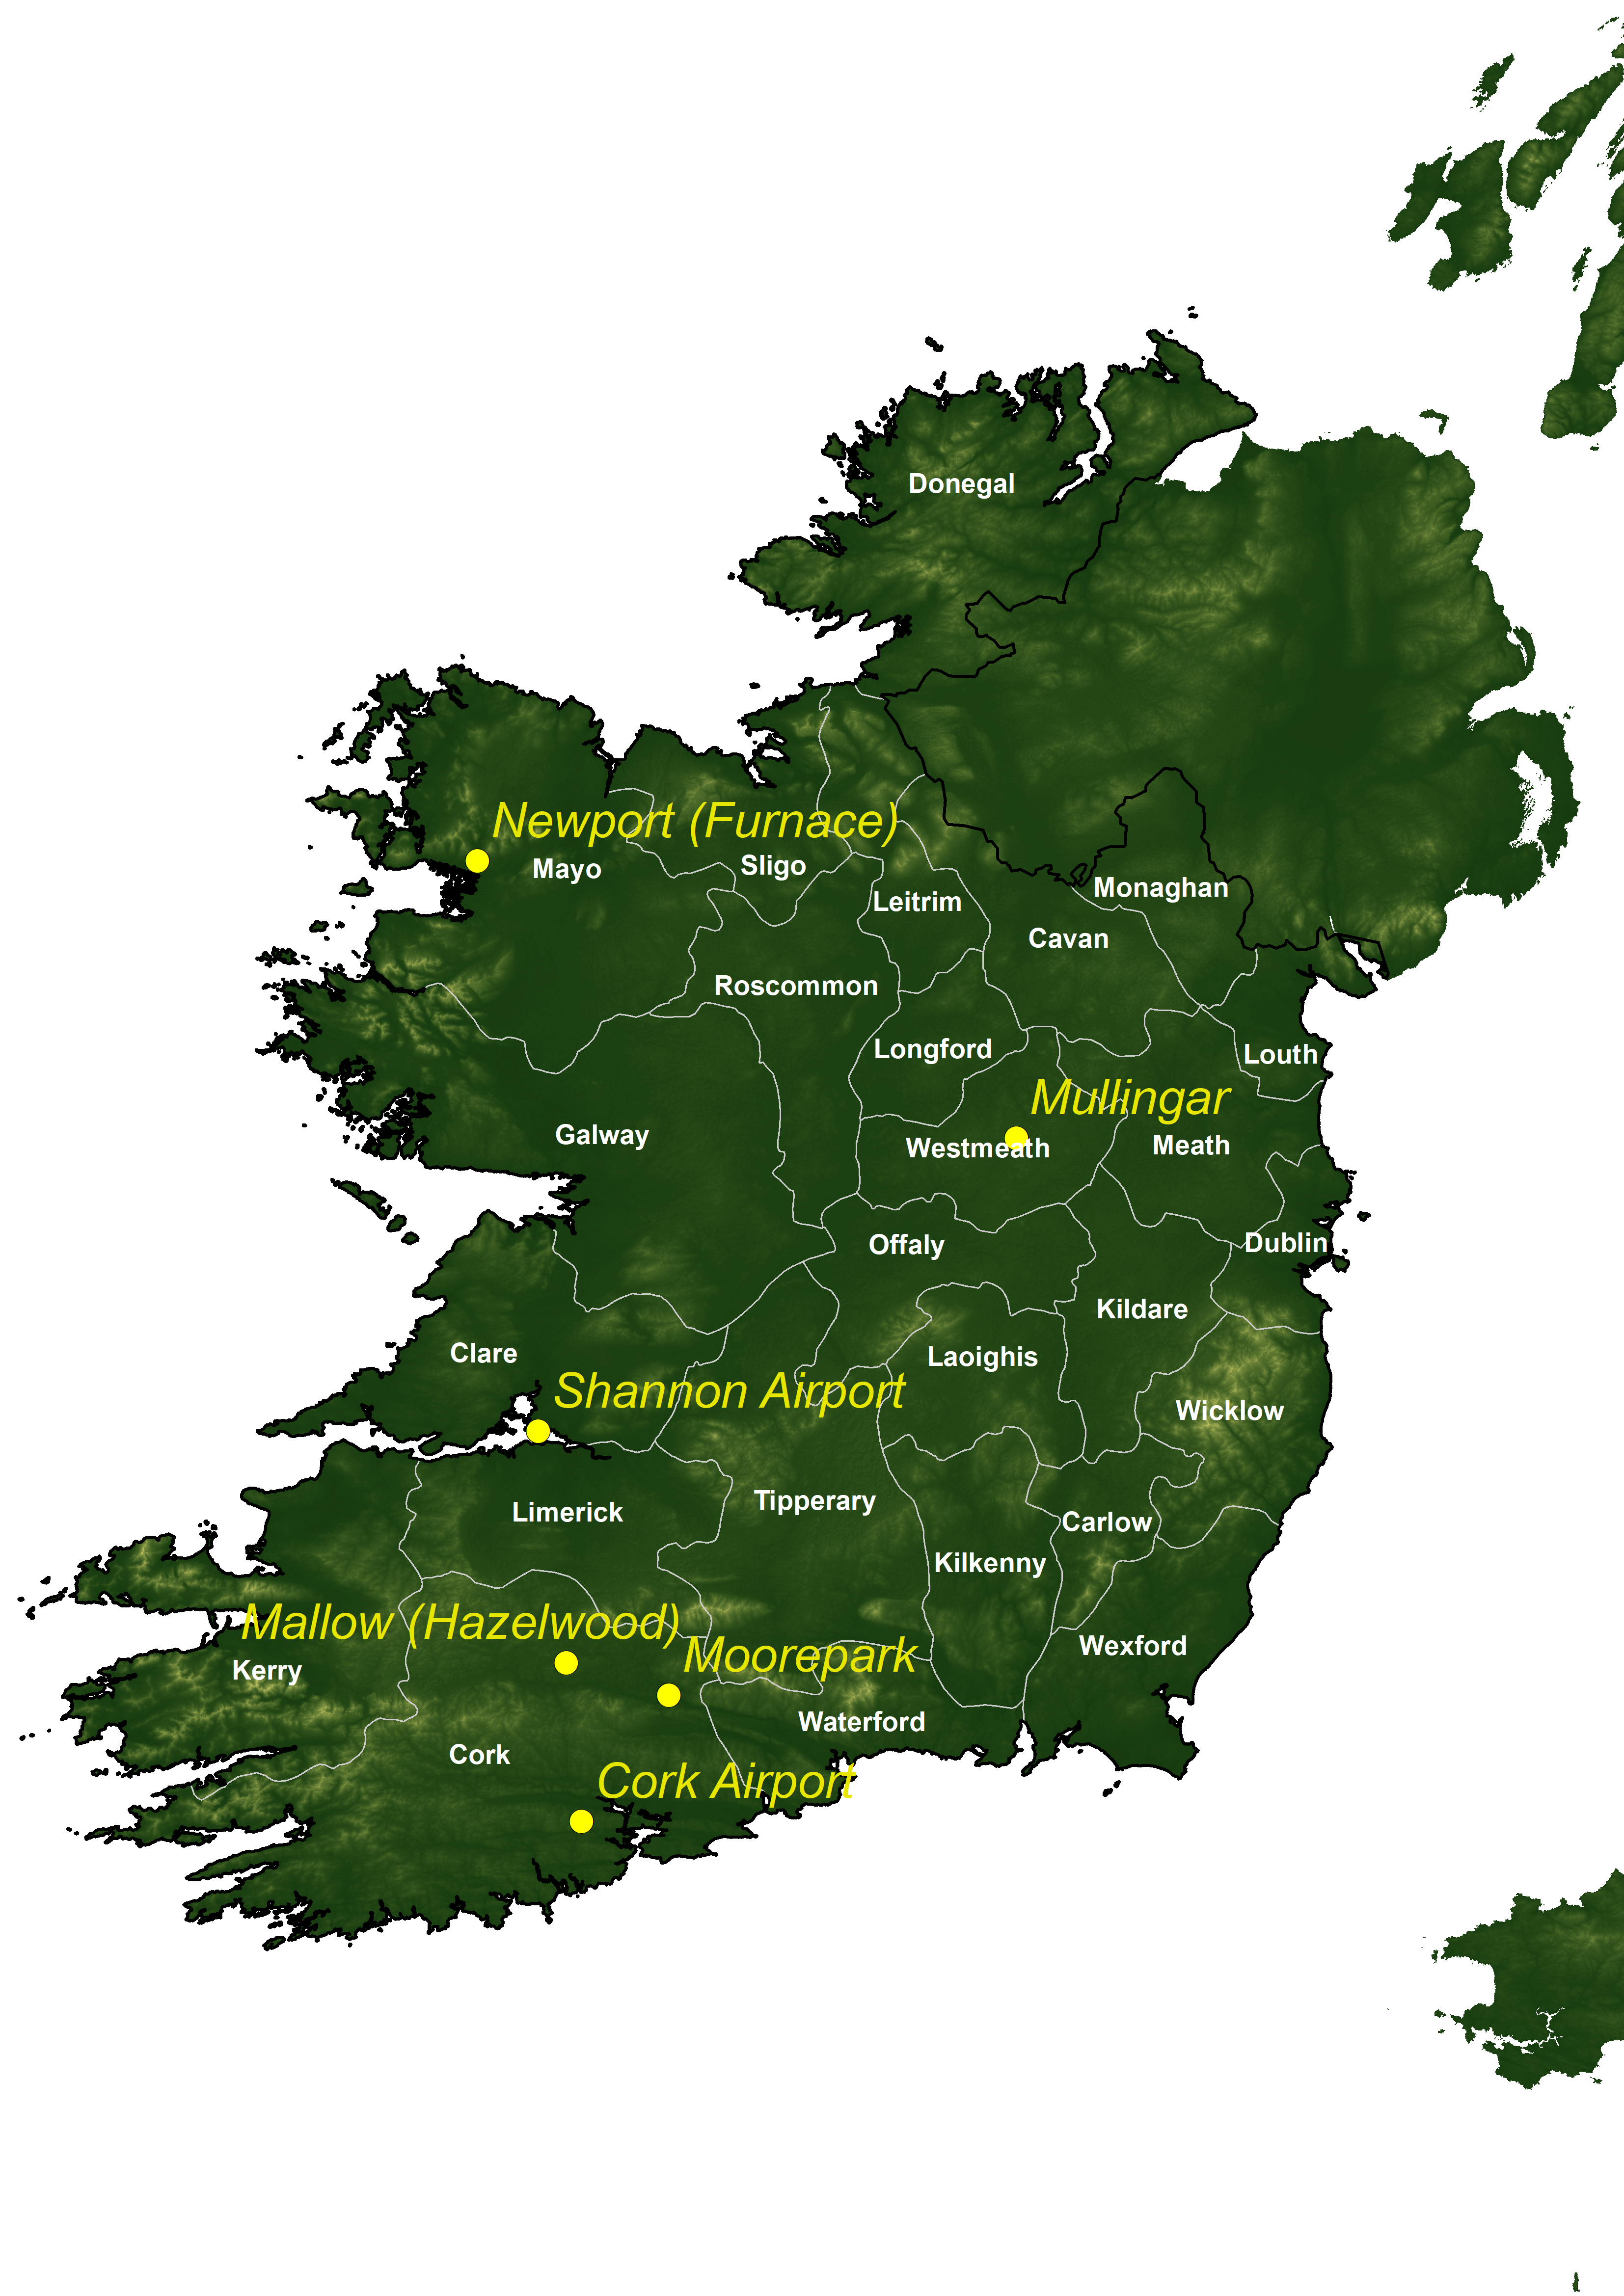
Figure 2. Locations of the meteorological stations used in this study to analyse meteorological variables and grass growth.
Soil temperature was converted into weekly averages for 2012. Due to productive grass growing weeks beginning when the weekly average soil temperature exceeds 5°C, weekly soil temperatures were plotted from January in order to determine when the farming weeks began in the year 2012.
A long-term continuous record of grass growth is available for Moorepark agricultural station in southwestern Ireland. The record extends from 1982 to 2015 and has been collected by Teagasc, the Irish food and agriculture development agency and described in (Hennessy et al, 2010). The unit of measurement for this grass growth record is tonnes of dry matter per hectare (t DM/ha). Grass growth for the Moorepark station for the year 2012 is shown in Figure 2.
Results
1. Minimum air temperatures and rainfall anomalies
a) May
For the year 2012, two locations -Shannon Airport and Mullingar- have an average temperature in May lower than the LTA of 1981-2010 (and the 1961-1990 LTA) (figure 3). All stations examined experienced a lower than average amount of rainfall for the month of May in 2012, with anomaly values ranging from 60% to 80% of the LTA (1981-2010).
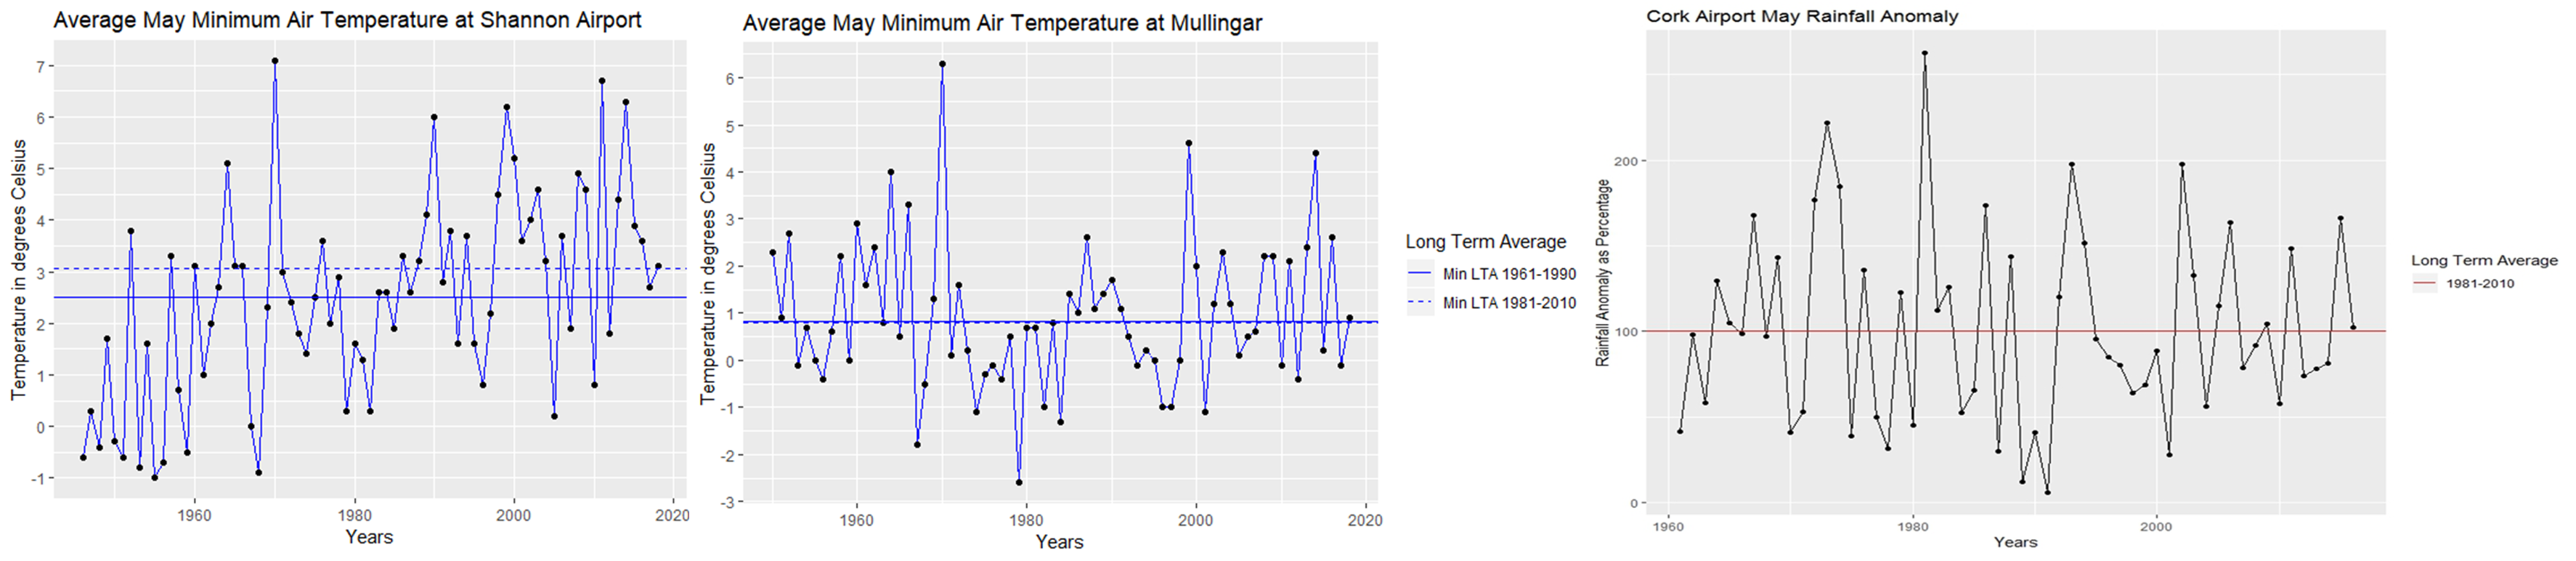
Figure 3. Average May minimum air temperatures for Shannon Airport (left) and Mullingar (centre). Continuous line represents the LTA of 1961-1990; the dashed line is the LTA for 1981-2010. On the right, rainfall anomaly for May expressed as percentage (%) with respect to the LTA 1981-2010.
b) June
For 2012, all stations except for Cork Airport had an average June minimum temperature on or above the 1981-2010 LTA (figure 4). Furthermore, the year 2012 was significant in terms of average rainfall at all five of the locations analysed. Newport (Furnace) had the highest amount of rainfall in the period 1960-2016. The anomaly values range from almost 200% of the LTA at Newport (Furnace) to 340% at Mallow (Hazelwood) (figure 4).
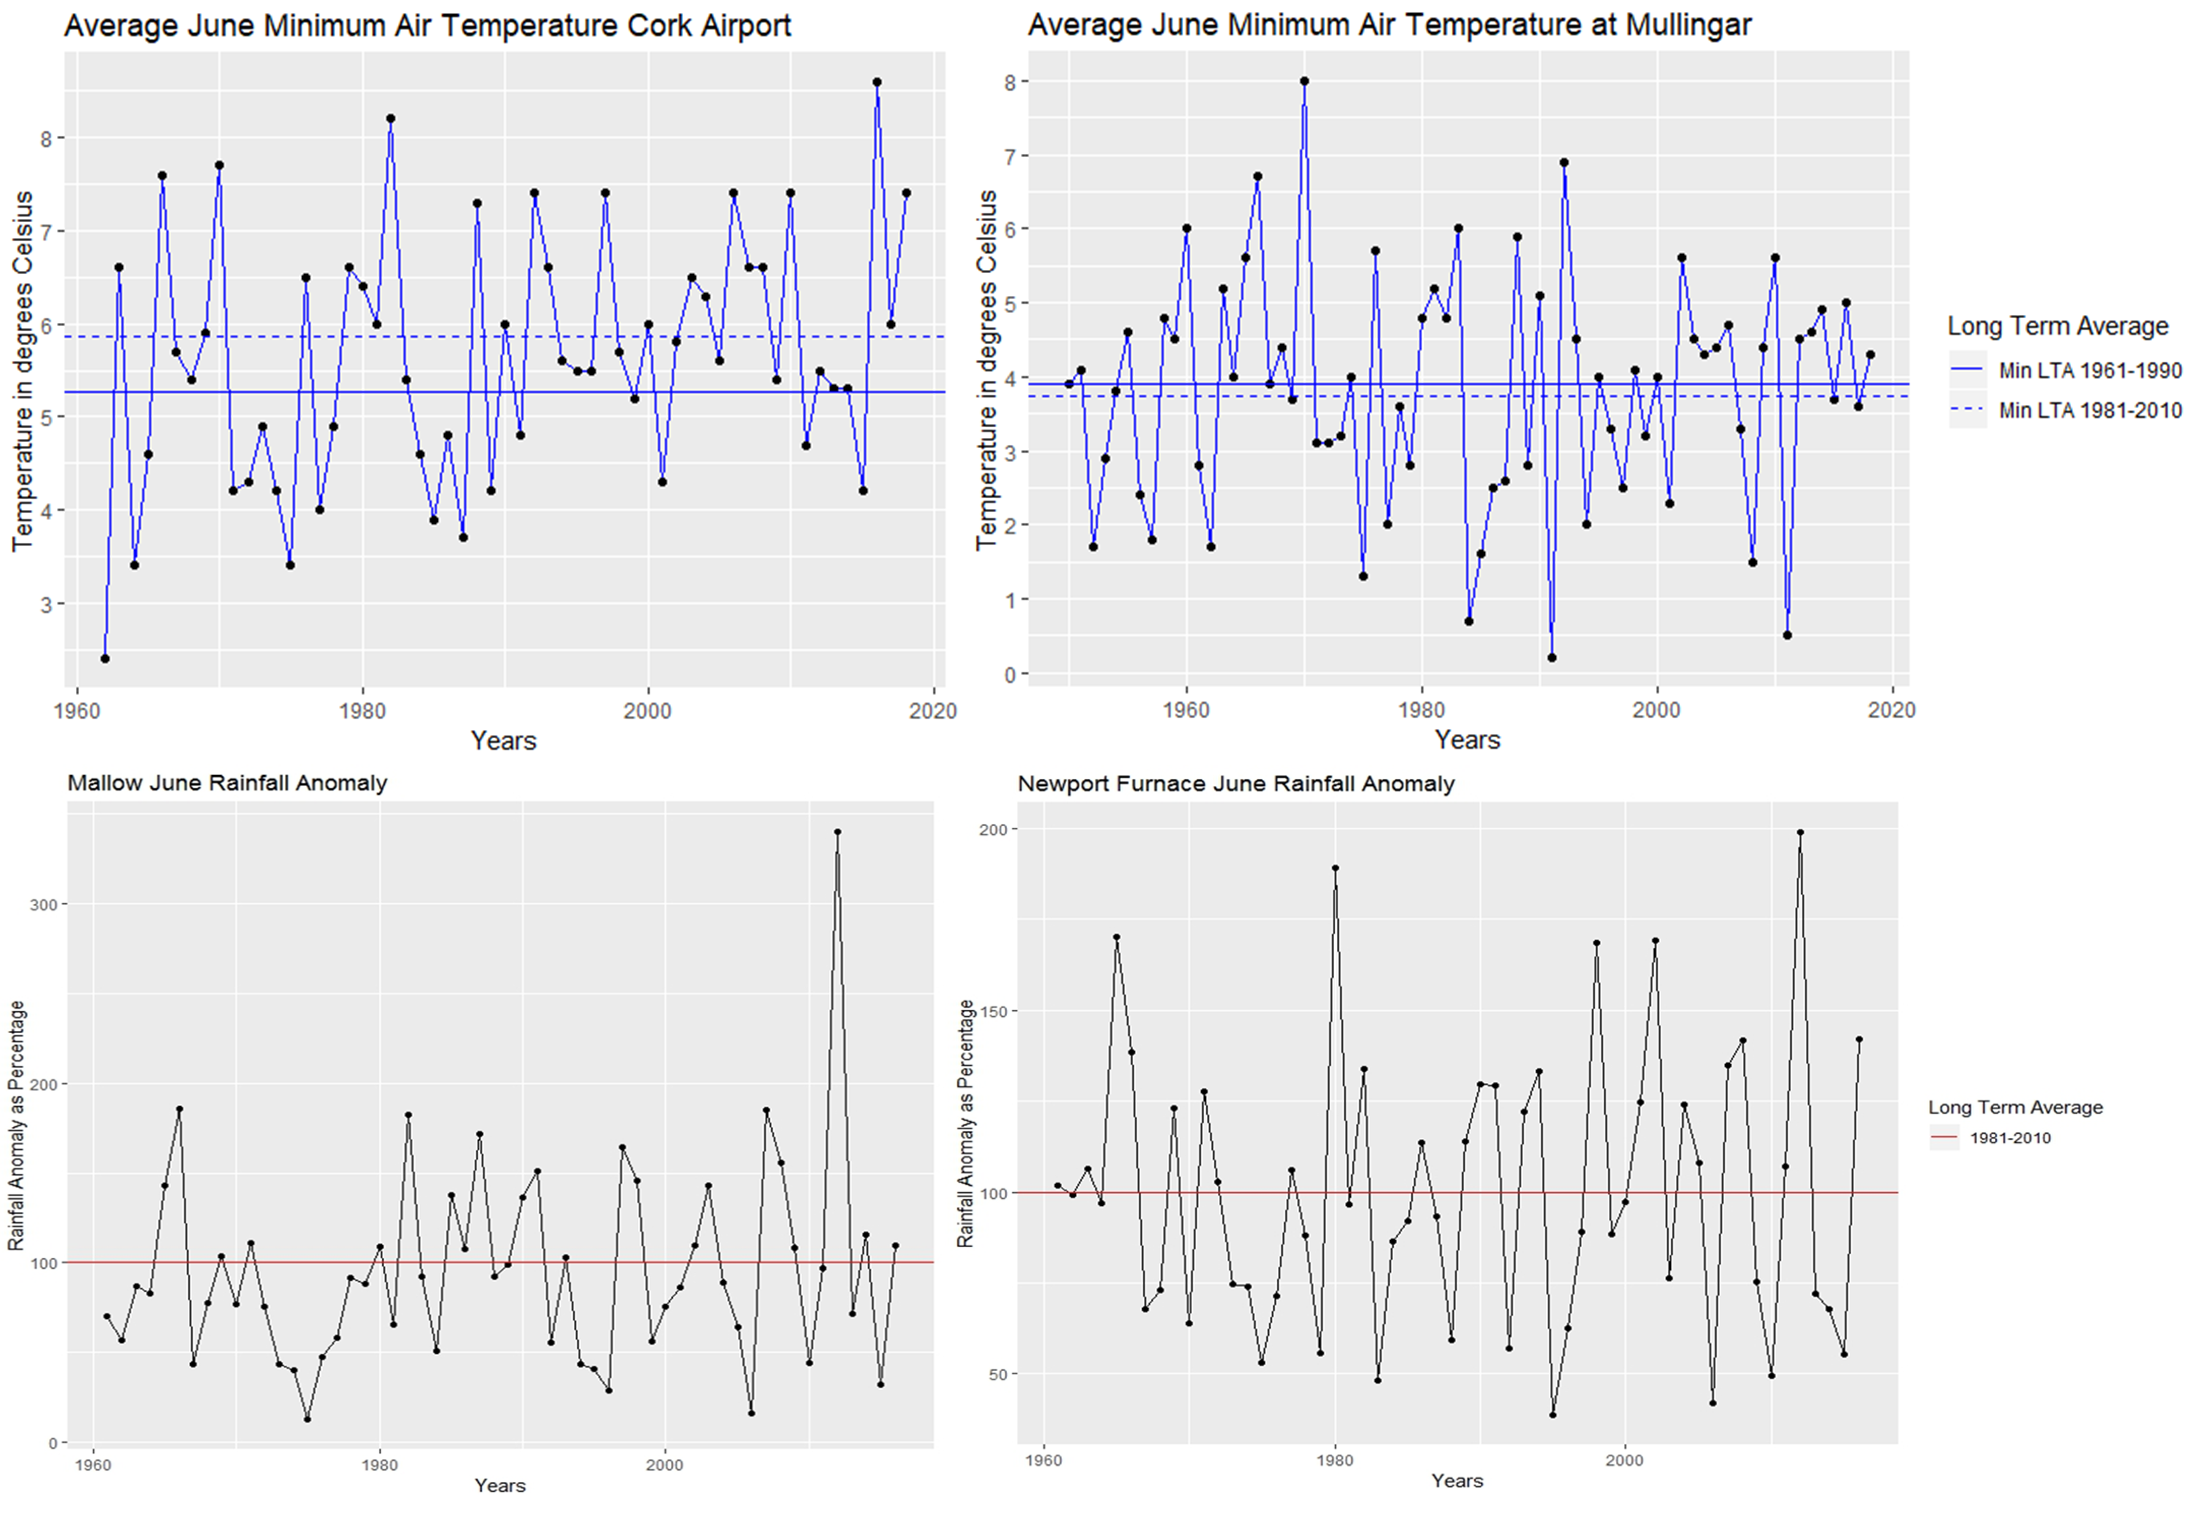
Figure 4. Average June minimum air temperatures for Cork Airport (top left) and Mullingar (top right). Continuous line represents the LTA of 1961-1990; the dashed line is the LTA for 1981-2010. Bottom, rainfall anomaly for June expressed as percentage (%) with respect to the LTA 1981-2010 for the stations of Mallow (Hazelwood) and Newport (Furnace) (left and right, respectively).
c) July
Three of the four stations had an average minimum temperature below both LTAs during 2012 (figure 5). The rainfall of July 2012 was above the LTA of 1981-2010 at all locations, with anomalies between 115% of the LTA at Newport (Furnace) and 170% of the LTA at Shannon Airport.
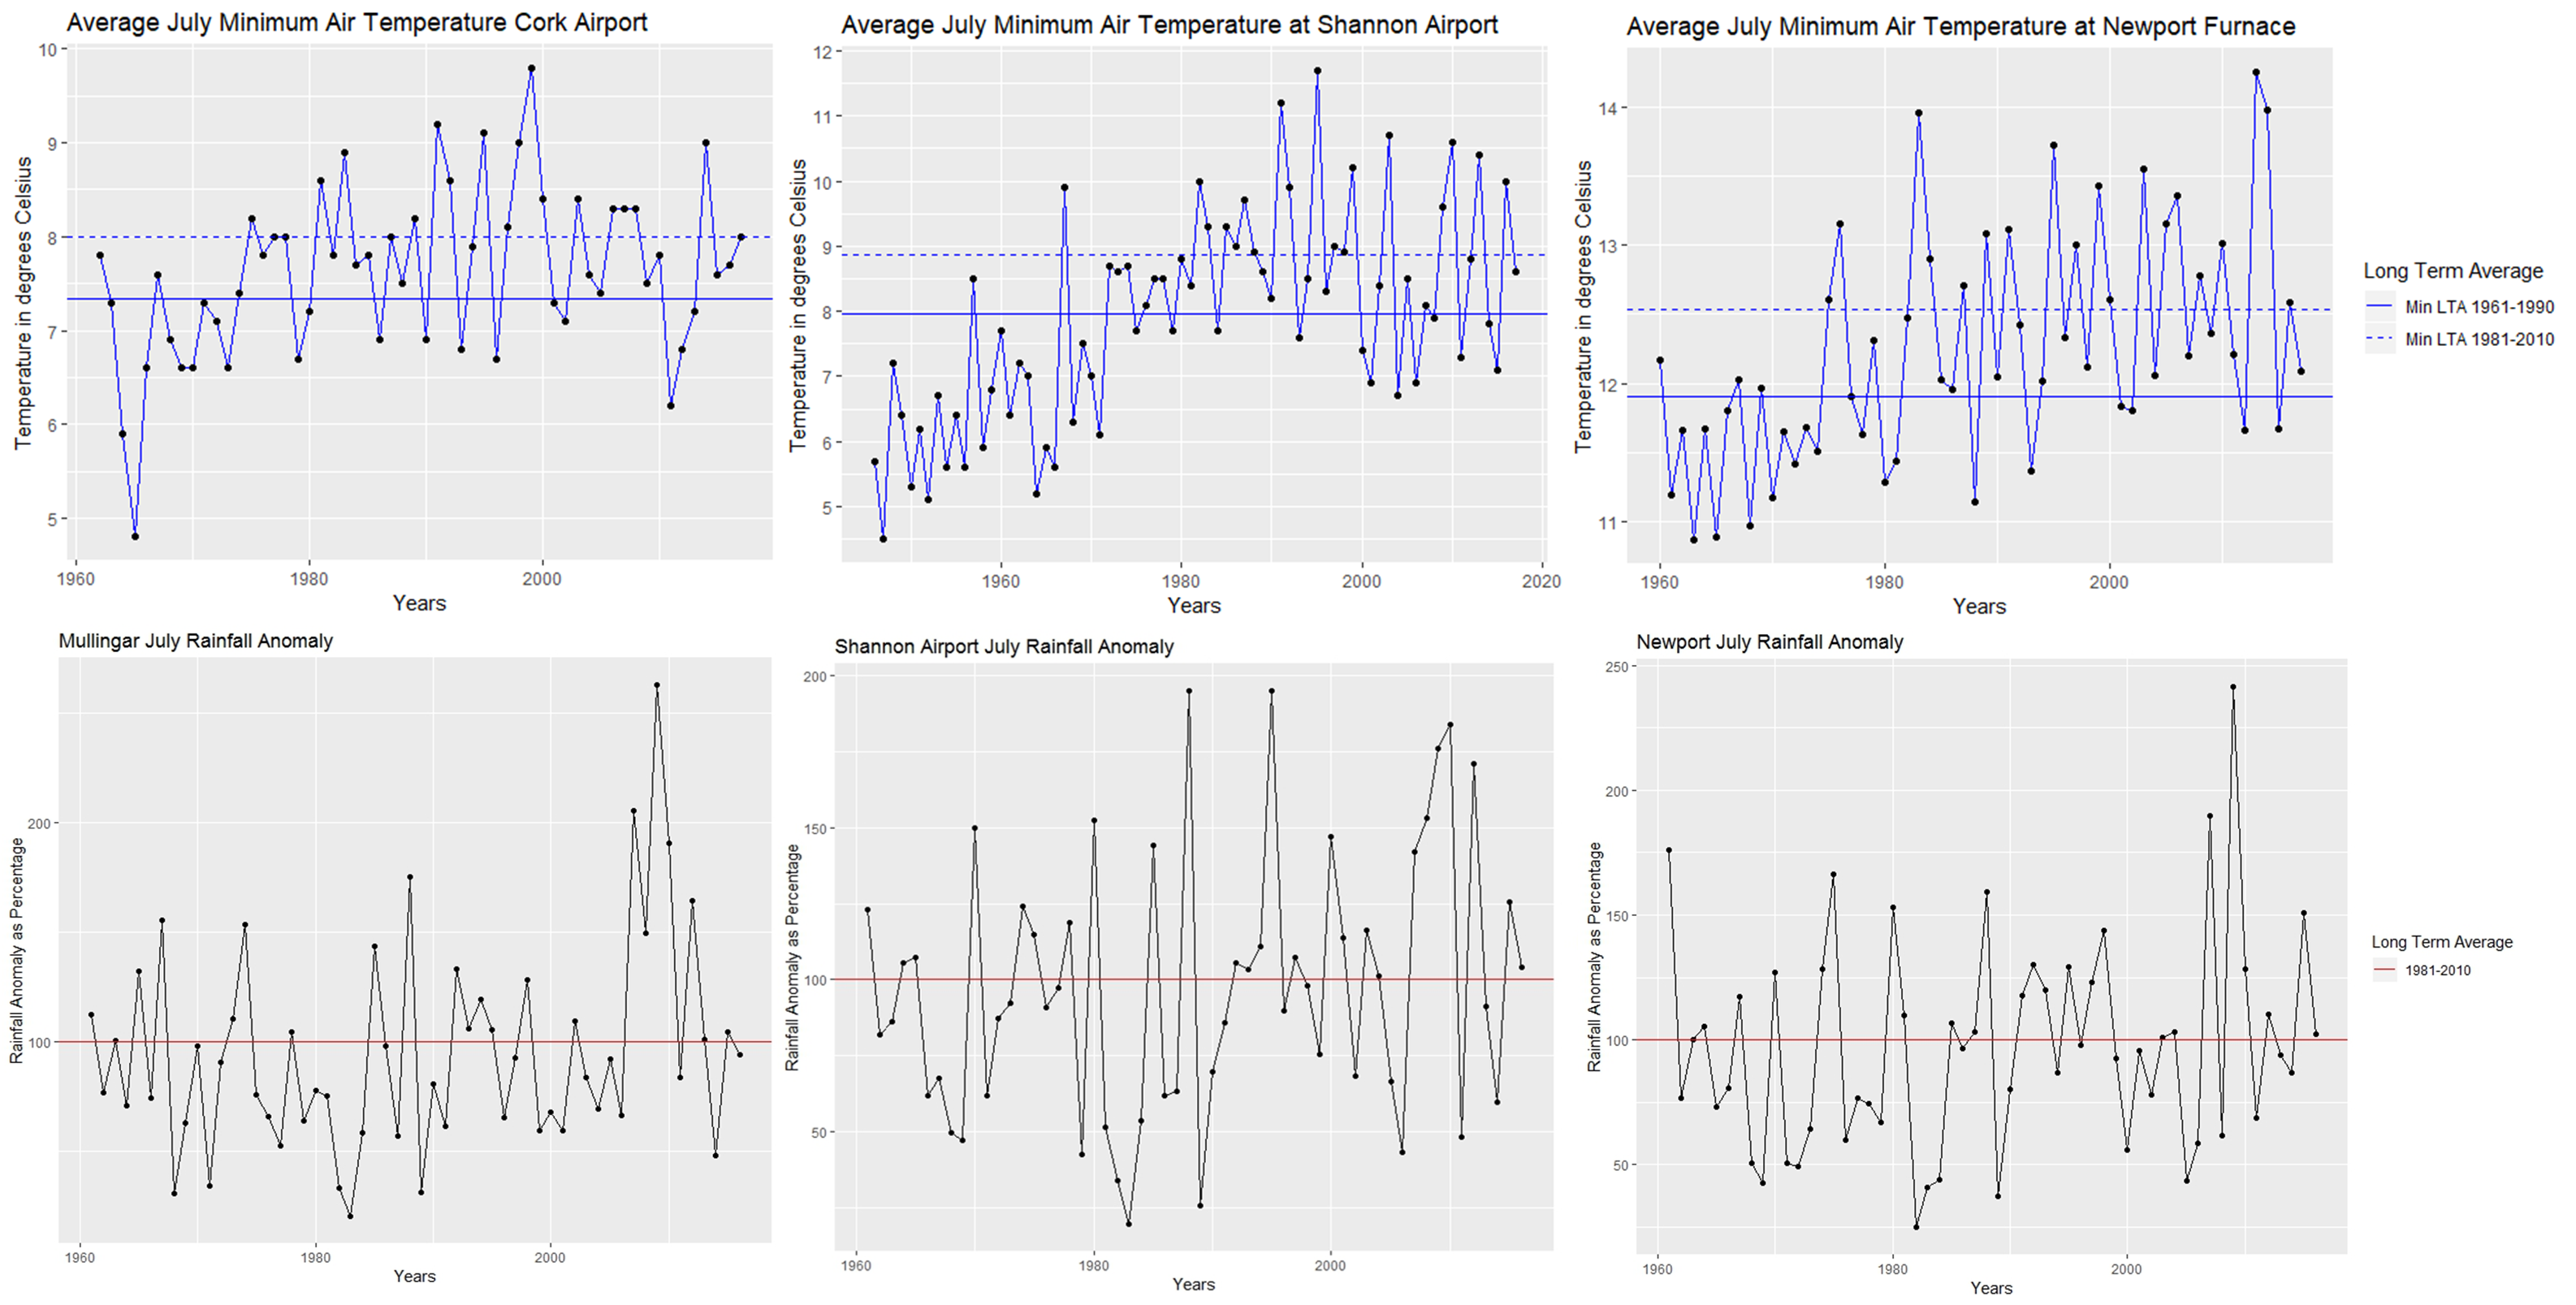
Figure 5. Average July minimum air temperatures for Cork Airport (top left), Shannon Airport (centre) and Newport (Furnace) (top right). Continuous line represents the LTA of 1961-1990; the dashed line is the LTA for 1981-2010. Bottom, rainfall anomaly for June expressed as percentage (%) with respect to the LTA 1981-2010 for the stations of Mullingar, Shannon Airport and Newport (Furnace) (from left to right).
2. 2012 weekly variables
The average weekly values of soil temperatures for week 1 vary between 5.0°C and 6.5°C (figure 6). Temperatures remain above 5°C for the following two weeks suggesting that the beginning of the growing season in 2012 was in fact at the beginning of January. Temperatures drop in week 5 to as low as 3.1°C in Mullingar, but remain on or above the 5°C threshold for the remaining weeks. The sharp drop in temperature in week 5 is common to both soil and minimum air temperature.
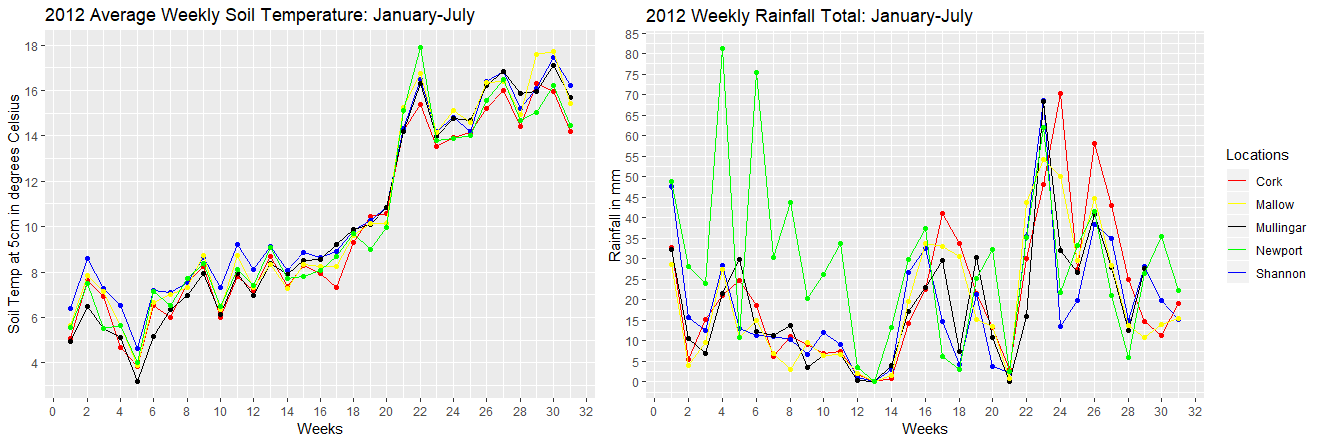
Figure 6. Left, average weekly soil temperature for the five stations from January to July. Right, weekly rainfall.
The 2012 weekly rainfall graph (figure 5, right) shows huge variability between weeks at Newport (Furnace). The considerably more amount of rainfall in that station may be due to its location on the western coast of the country. The larger quantities of rainfall seen between weeks 22-26 at all locations echo the previous data in this report highlighting the enormous rainfall levels of June 2012.
3. Grass Growth at Moorepark
Weeks 6 to 13 show above average grass growth at Moorepark during 2012 (figure 7). A huge drop in grass growth occurs through weeks 24-28. The grass growth increases above average from weeks 30-38. The weekly grass growth at Moorepark illustrates clearly how the grass growth pattern varied in 2012 compared to the LTA (1981-2010) and the average of the period.

Figure 7. Comparison of the weekly grass growth of 2012, the average of the period analysed (1981-2015), and the LTA 1981-2010.
Conclusions
There is no evidence to suggest that significantly colder than average minimum air temperatures in the month of June were the sole cause of the decreased grass growth observed in the summer of 2012.
The rainfall experienced in the months of June and July 2012 were significant, with June seeing a record breaking amount of rainfall at all locations.
An examination of the patterns of grass growth against the recorded rainfall shows a strong link between the excessive amount of rain and the quantity of grass which grew during the same period. It is very plausible that the heavy rainfall of June followed by the above average rainfall of July may have been instrumental in the decreased crop growth of that year.
Rainfall is a significant factor controlling grass growth. Too much rainfall, as seen in June and July 2012, can hinder grass growth. However, too little rainfall may also hinder grass growth, as appears to be the case in 2018, although further research need to be carried out.
Acknowledgements
We would like to thank the SEFS Undergraduate Summer Research Bursary 2018 for providing the funding for this research.
REFERENCES
-
- Agriland.ie (2013). Fodder Crisis Cost Irish Farming €500m [Accessed 14th August 2018].
- Brereton, A.J., Danielov, S.A. and Scott, D. (1996). Agrometeorology of Grass and Grasslands for Middle Latitudes. World Meteorological Organisation, 839(197).
- Connaughton, M.J. (1973). The Grass Growing Season in Ireland. Agrometeorological Memorandum, 5(1).
-
- European Commission-Ireland (2018). Agriculture|Ireland [Accessed 14th August 2018].
- Hennessy, D., Hurtado-Uria, C., Shaloo, L., Schulte, R., Delaby, L., O’Connor, D. (2010) Evaluating grass growth models to predict grass growth in Ireland. Proceedings of the 1st EGF Working Group on Grazing, Kiel, 29 August 2010. Available: http://www.europeangrassland.org/working-groups/grazing.html
- Hurtado-Uria, C., Hennessy, D., Shalloo, L., O’Connor, D. and Delaby, L. (2013). Relationships between meteorological data and grass growth over time in the south of Ireland. Irish Geography, DOI: 10.1080/00750778.2013.865364
ClimATT
Climate Change Attribution of Extreme Weather Events
Contact us