Furthermore, there is no precedent in the era of modern satellite imagery and only in 1878, 1886 and 1893 can we find a comparable situation. So far this season there have been 357 deaths and an estimated $186.8 billion in damages, and as the hurricane season doesn’t finish until the end of November, what else can we expect?
In this context, Ophelia, the 15th named storm of the season (, has stood out as a stubborn hurricane with a trajectory bound for the mid-latitudes of Western Europe. Although it is not impossible for a hurricane to form in the region south of the Azores Islands, it is quite unusual. We have to look back to 1851 for such an event to happen (Henson, 2017). Even Michael in 2012 was 1.450 km further into the Atlantic (Henson, 2017). This makes Ophelia the hurricane with the furthest easterly position in the Atlantic and also the furthest north recorded since 1939 (
Usually cyclones such as this one impact Ireland after following a long trajectory through the Atlantic, from west to east. However, if they are formed off western Africa they do not have to travel as long a distance to reach us as their American relatives, and therefore even when environmental conditions are not equal to those on the other side of the Atlantic, these cyclones can conserve most of their damaging characteristics (Haarsma et al., 2013).
For such a cyclone to develop the surface water temperature needs to be at around 27ºC. The warmer water 1.400 km off the coast of the Azores made possible the formation of “Tropical Depression Seventeen” (NHC, 2017), as it was called by then, on October 9th (Echo News, 2017). The depression strengthened and obtained the right to be given a name: Ophelia, although it wasn’t until the 11th that she became a hurricane with winds of 105 km/h.
On the 12th October the approach of Ophelia to Ireland gained media and public interest, since Met Éireann started to seriously warn about the characteristics of Ophelia and its potential for damage. Winds of 170 km/h were recorded at that stage and from 50 to 100 mm of rain was forecast for the Azores that weekend (NHC, 2017).
In the beginning of her journey, Ophelia moved to the southeast and veered later towards the northeast. After remaining Category 1 and being static between the trade winds and the westerlies (Fonseca, 2017), she started moving towards the northeast, with the maximum winds up to 170 km/h. On Saturday 14th she was considered Category 2 and was subsequently reclassified as Category 3 in the same day, when she passed the Azores.
During the night from Saturday to Sunday, the eye of the hurricane became indistinguishable. Nonetheless, the core of the storm was what impacted on Ireland, and not the tail. This, together with the fact that Ophelia was caught by a trough propelling her to move north and northeast, made Ireland more vulnerable to the high winds, precipitation and storm surge in the southwestern and southern areas. Furthermore, the upper jet streak helped to deepen the low pressure (NHC, 2017).
As the hurricane moved above colder waters, even despite the positive temperature anomaly of around 2ºC, she changed to an extra-tropical depression or post-tropical cyclone. As such, she transitioned from having a warm core and axial symmetric structure to being asymmetrical, with the low and mid-level centers separated (NHC, 2017), and lower core temperatures.
Sea Surface Temperature Anomaly in the Atlantic Ocean the 14th October 2017. Source: NCEP/NOAA.
Her movement was influenced by the Coriolis force and the trade winds from the west, and she was soon being driven by the westerly winds (Haarsma et al., 2013). Although now an ex-hurricane, the winds were still close to hurricane level once she landed, in particular in the sting jet, which is the frequent cause of windstorms. Furthermore, higher winds were present in the eastern and southern flank of the low, which changed direction as the extra-tropical cyclone passed through the country.
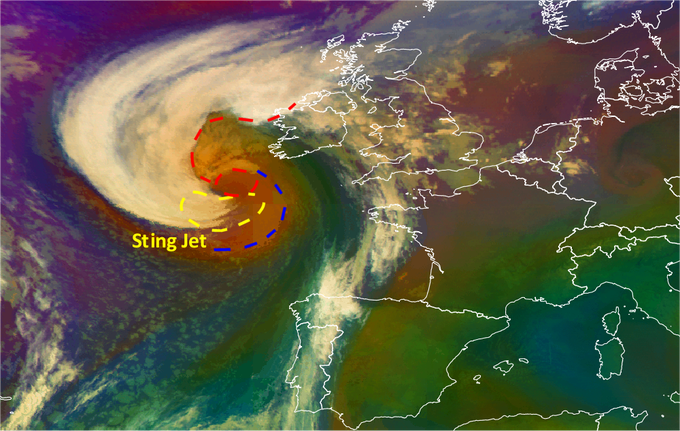
Air masses satellite image showing the position of the sting jet in ex-hurricane Ophelia. Source: @KeraunosObs.
It is true that positive anomalies in SST (Sea Surface Temperature) could slow the transition (see picture above). However, the baroclinic instability of mid-latitudes can promote a re-intensification of the depression (Haarsma et al., 2013). Indeed, this instability is the one which led to a previous formation of a similar storm in that area (Haarsma et al., 2013).
On Sunday morning the National Emergency Coordination Group was in place to evaluate the situation and put into practice all the appropriate measures according to the red wind warning for the coastal areas and orange for the rest of Ireland issued by Met Éireann.
The predictions came true when on Sunday it was claimed to be the strongest storm in Ireland since Debbie (in that occasion, in 1961, 18 people died), or Charley in 1986, with 11 deaths (Evening Echo, 2017).
The initial warnings were finally extended to all the country from 9 am on Monday to 3 am on Tuesday as Ophelia approached.
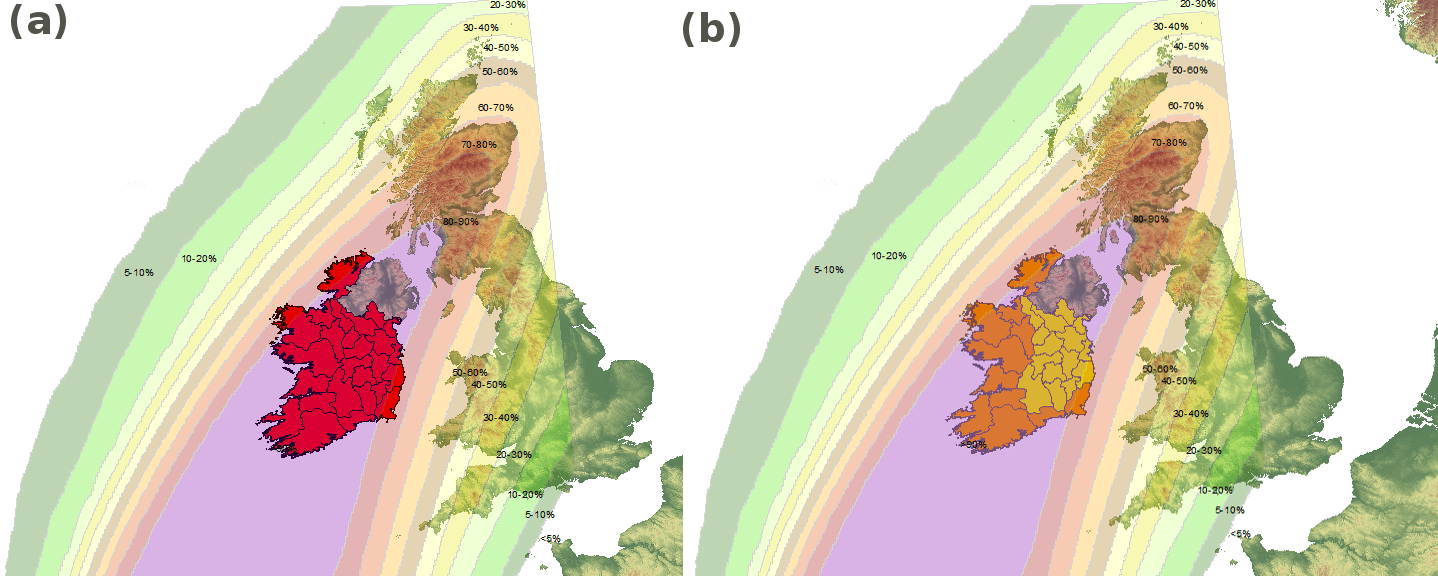
Red warning for winds (a) and orange and yellow warning for rain (b) issued by Met Éireann due to the expected high probability of very strong winds directly impacting Ireland.
On that same day, Met Éireann informed the public about the approximate times of Ophelia’s arrival for different areas:
- From 7 am: Coastal areas of counties Cork and Kerry.
- From 9 am: Remaining parts of Munster.
- From midday: South Leinster and Galway.
- From 1 pm: Dublin and remaining Leinster.
- From 3 pm: North Connacht and Ulster.
Once Ophelia made land she crossed the country causing damage on her way northwards. At 2 pm on Monday 16th the NHC (National Hurricane Center) stopped following Ophelia and Met Éireann published some of the strongest gusts and rainfalls recorded by that time:
- 191 km/h at Fastnet Rock (6.5km SW of Cape Clear Co. Cork, at a height of 200ft).
- 156 km/h at Roches Point.
- 135 km/h at Sherkin Island.
- 126 km/h at Cork Airport.
- 122 km/h at Shannon Airport.
Rainfall:
- 17 mm at Valentia, including 9mm in one hour.
- 17 mm at Mace Head, including 8mm in one hour.
The warnings encouraged people to stay safe indoors while Ophelia was still impacting the country in order to avoid fallen trees or power lines, closed roads, debris or high waves. Moreover, some places were provided with sandbags. However, the response from the government has raised some criticism for its slow reaction (Daly, 2017).
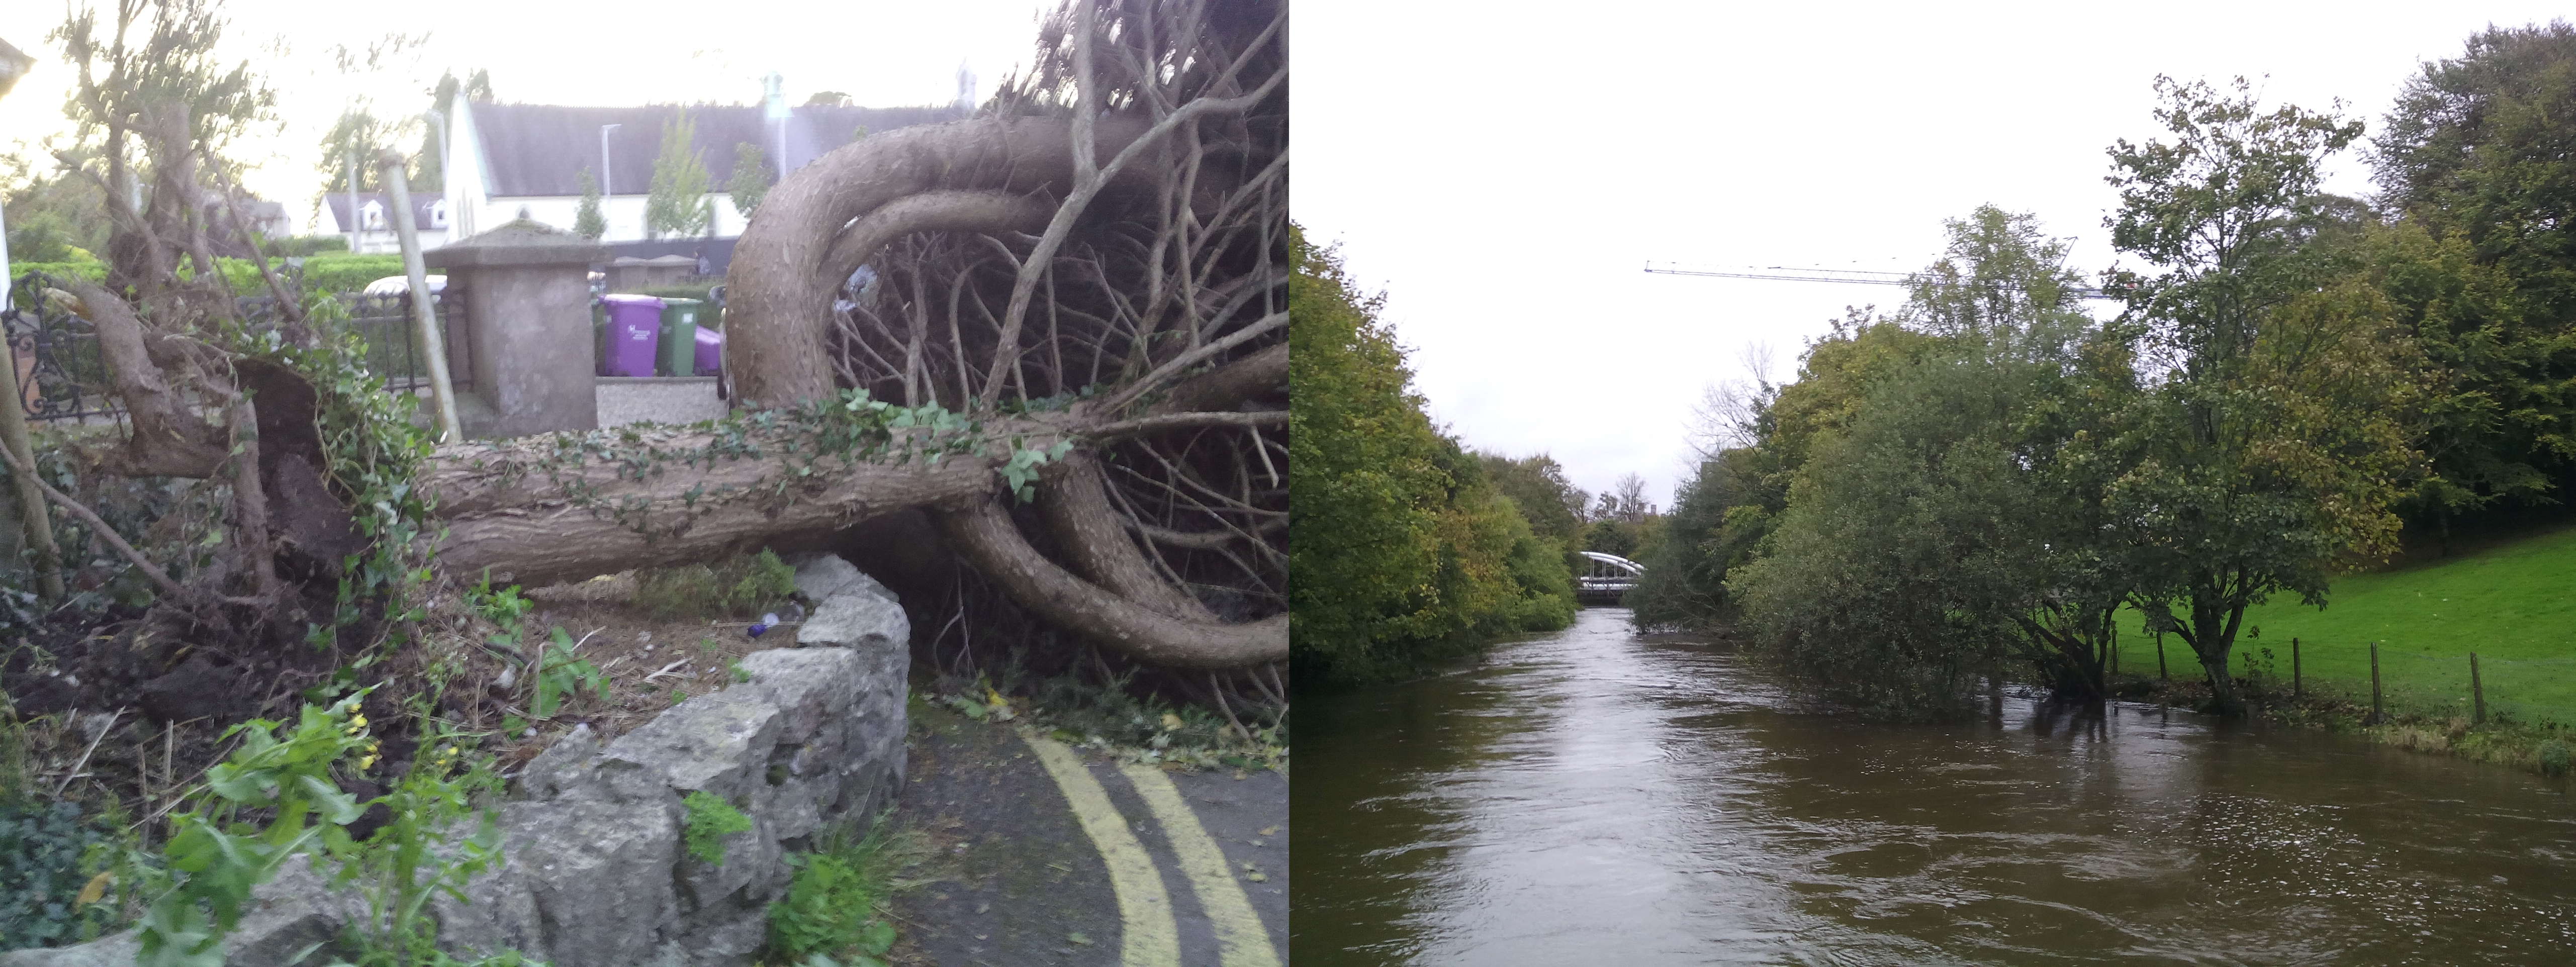
Pictures of the aftermath of ex-hurricane Ophelia in College Road and high water levels in the south branch of the river Lee passing through the Brookfield bridge, Cork.
Authorities urged people in low coastal areas to be prepared in light of the 4 pm high tide. Fortunately, no significant tidal flooding was reported (Niamh et al., 2017).
However, there were accidents which ended tragically. A woman died in Aglish, Waterford, when a tree fell and hit her car, as wind gusts of more than 130 km/h reached the south (The Independent, 2017). Two more people died during the day and there were also reports of injured people. Intervention from the Coast Guard was needed to rescue kite surfers.
Numerous flights, more than 200, (The Independent, 2017) were cancelled on Monday, schools and institutions such as University College Cork (UCC) closed, public transport (bus, train, ferries) and other events were cancelled or rescheduled. Postal services, courts, government institutions, businesses, small and large shops,… all announced that they would remain closed in light of the high winds and the resulting risk for their employees. Also, Cork University Hospital (CUH) cancelled procedures. Measures were taken to offer assistance to elderly and homeless people. Hotels were recognised for their services and many farmers had to resort to generators for electricity.
The ESB (Electricity Supply Board) was updating the list of incidents as Ophelia advanced to the north of the country. Power outages increased continuously until an estimated figure of 360.000 customers were without power, 450.000 homes and businesses. They also warned that it could take up to 10 days before electricity was restored. Broadband and telephone services were interrupted too (The Independent, 2017). Water supply was also disrupted in some areas.
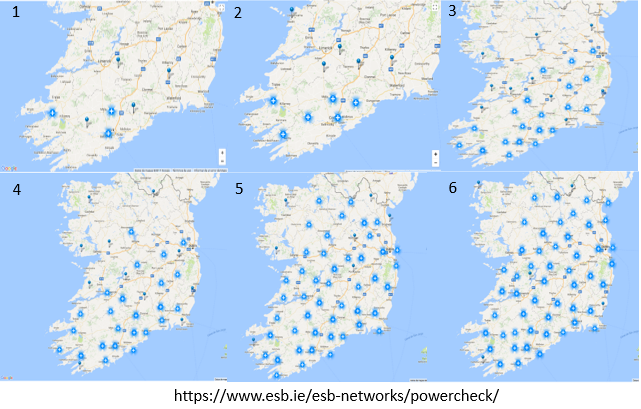
Service interruptions updates during storm Ophelia. Source: ESB.
The economic damage was forecast to be around 700 m euros, but this figure increased as the storm advanced up to 1.5bn euros (The Independent, 2017).
What about an attribution study of Ophelia?
The great majority of attribution studies focus on extreme temperatures and precipitation since these have greater reliability. Events such as tropical and extra-tropical cyclones, together with wildfires and severe convective storms (NASEM, 2016), experiment changes in their physical mechanisms due to climate change that are less understood.
Prediction of this kind of weather system is extremely difficult. First of all because there is a combination of various specific ingredients needed for a hurricane to develop and in order to determine its intensity and trajectory. Besides, these events lack continuous observational time series with the necessary quality and duration. Rather, we have discrete events whose fragmented time series hinder the application of a proper study of extreme values. Even more, when we use models it is important to be aware of their limitations in the reproduction of extra-tropical cyclones. Their performance is even worse when referring to tropical cyclones (NASEM, 2016). All those factors lead to a low confidence when performing attribution studies of anthropogenic climate change for extra-tropical cyclones.
Nonetheless, the ingredients necessary for a hurricane or an extra-tropical cyclone to develop can shed some light about their potential changes in a warming climate. Yet, there is an implicit assumption that the underlying physical mechanisms are well-understood and that current relationships between variables and mechanisms will be maintained in the future.
Even so, there is already some evidence that anthropogenic climate change has potential impacts in terms of the frequency and/or intensity of tropical and extra-tropical cyclones. First of all, the increase in the mean global SST will have multiple different consequences. On one hand, the thermal expansion of the water in seas and oceans together with the melting of the main ice cores constitutes an increased risk of coastal flooding due to higher sea levels and storm surges. Extreme sea levels during storm surges have already been observed since 1970 (IPCC, 2014). The SST difference between the Pacific and Atlantic oceans also affects the wind shear, although with considerable uncertainty (Haarsma et al., 2013). On the other hand, warmer water leads to an increase in the moisture holding capacity of the atmosphere, which increases exponentially according to the Clausius-Clapeyron relation (7% per degree temperature).
It is also necessary to take into consideration that an increase in mean global temperatures decreases the temperature gradient between the equator and the poles, creating the instability that drives air masses from south to north in the Northern Hemisphere. Therefore, a smaller gradient would be expected to imply less instability. However, a warmer atmosphere expands, increasing the height of the tropopause and the latent heat and therefore contributing to the instability.
As a result of considering some of these various factors, longer sustained systems are expected to move through the Atlantic, and some authors have already obtained a decrease in the number of hurricanes although with a higher intensity. According to Haarsma et al., (2013) an increasing number of tropical hurricanes arriving to western Europe is also probable in a future scenario.
REFERENCES
- Daly, S. (2017). Leo Varadkar: The government IS prepared for Storm Ophelia, The Journal.ie, 16th Oct. [Accessed 17th Oct. 2017].
- Echo News (2017). Tracing Ophelia’s collision course with Ireland and the UK, 16th Oct. [Accessed 20th Oct. 2017].
- Evening Echo (2017). Videos: Storm Ophelia leaves thousands without power, 16th Oct. [Accessed 20th Oct. 2017].
- Fonseca, X. (2017). El ciclón tropical “Ophelia” afectará a Galicia, La Voz de Galicia, 12th October. [Accessed 14th Oct. 2017].
- Haarsma, R.J., Hazeleger, W., Severijns, C., de Vries, H., Sterl, A., Bintanja, R., van Oldenborgh, G.J. and van den Brink, H.W., (2013). More hurricanes to hit western Europe due to global warming, Geophysical Research Letters, 40(9), pp.1783-1788.
- Henson, B. Ophelia hits category 3; destructive winds on tap for Ireland, Weather Underground, 14th October. [Accessed 15th Oct. 2017].
- Accessed 19th Sept. 2017].
- NASEM (2016). Attribution of extreme weather events in the context of climate change, National Academies of Sciences, Engineering, and Medicine. National. Academies Press.
- NHC (2017). Hurricane OPHELIA advisory archive, National Hurricane Center. [Accessed 15th Oct. 2017].
- Niamh T., Anne L., Cliff T., Barry R., Freya McClements, Gerry M., Marese McDonagh, David R., and Stephen, M. (2017). Hurricane Ophelia: How is it impacting on your area?, The Irish times,[Accessed 18th Oct. 2017].
- IPCC, 2014. Climate Change 2014: Synthesis Report. Contribution of Working Groups I, II and III to the Fifth Assessment Report of the Intergovernmental Panel on Climate Change [Core Writing Team, R.K. Pachauri and L.A. Meyer (eds.)]. IPCC, Geneva, Switzerland, 151 pp
- The Independent (2017). Storm Ophelia wreaks havoc: Three lives lost as weather phenomenon disrupts transport, water and electricity networks, [Accessed 20th Oct. 2017].