In This Section
Emma and the Beast
The weather that we experienced last week is not atypical in its origins. It was caused by an anomaly in the dynamic of the atmosphere that usually happens in our latitudes during the winter season (Met Éireann, 2018).
The weather that we experienced last week is not atypical in its origins. It was caused by an anomaly in the dynamic of the atmosphere that usually happens in our latitudes during the winter season (Met Éireann, 2018).
There are other factors that can enhance a meteorological situation like this one such as the Artic Oscillation (AO) and the North Atlantic Oscillation (NAO), volcanic eruptions or low sunspot numbers that can act alone or through the modulation of the AO and NAO (Hickey, 2011).
This event of snow showers, low temperatures, gales and blizzards, is similar to other past events. For example, the one in January-March 1947 with a “Great Blizzard”, January 1982 named the “Big Snow”, or December 1962-February 1963 called the “Big Freeze”. A more recent cold spell was the one during November-December 2010.
The Sudden Stratospheric Warming
The cause of this phenomenon is a so-called Sudden Stratospheric Warming (SSW). According with the World Meteorological Organization (WMO) SSWs may be classified as minor or major. The minor warmings occur when a temperature increase of at least 25ºC is observed in a period of a week or less at any stratospheric level. Major warmings are those with a temperature increase of at least 30ºC in a week or less at 10 mb (around 30 km height, in the stratosphere) or below, or by at least 40ºC above 10 mb (WMO CAS, 1978).
The stratosphere is the layer of the atmosphere situated between 10 and 50 km (figure 1). This layer is just above the troposphere, the lowest part of the atmosphere where most of the weather that we experience is developed. These two layers are not isolated from each other. They form a continuum where changes are propagated from one layer to another instead of being confined to a specific part of the atmosphere.
Figure 1. Layers of the atmosphere. Source: NASA ESPO/INTEX-NA Educational Outreach.
However, even though SSWs are not uncommon, the recent SSW set some historical records, with temperature increases up to 50ºC in the Arctic in the stratosphere and so it has been classified as a major SSW.
The warming that released the weather of last week was also coupled with an important decrease in the sea ice concentration just to the north of Greenland. This is fostering debate among scientists about the extraordinary character of this event and the potential role of climate change in the Arctic and consequently in the climate of northern Europe (Watts, 2018) (figure 2).
Figure 2. Variation of the sea ice concentration (%) north of Greenland during the period 20th– 25th February 2018. Source: reproducible without permission from @seaice_de.
The Polar Vortex
The stratospheric warming has a direct effect on the polar vortex. This vortex is a surface of cold air in the stratosphere around the Polar High (a high pressure centre over the North Pole), that is confined to high latitudes during winter by the polar night jet. This is a jet stream, a belt of high-speed winds that circulates from west to east around the Arctic, and it constitutes a natural frontier between cold air to the north and warm air to the south.
The SSW alters the vortex due to the weakening or even the complete cessation of this belt of high-speed winds. The interruption of the wind circulation from west to east fosters the development of waves in this boundary which separates the air masses of opposite temperature. Furthermore, globally, anthropogenic climate change is known to have already reduced the differences in temperatures between different latitudes, thereby decreasing the existent gradient between the equator and the pole that, as consequence, could attenuate the net cold-warm air division in the vicinity of the Arctic.
The deceleration of the polar vortex caused by the warming has two possible different outcomes: either the weakened vortex moves southwards or, as has happened on this occasion, that it splits into two vortices (Butler et al., 2014) (figure 3). The vortex situated over northern Europe has a retrograde circulation, that is, it blows from east to the west, a clockwise anti-cyclonic flow. This system of high pressure was located around Scandinavia, and channelled cold polar continental air from the east of Europe towards the west in a northeasterly direction. This dry and cold air mass caused the thermometer to plunge. This is “the Beast from the East”. The exact trajectory of this cold air, together with its interaction with other air masses of different characteristics coming from the southwest, i.e. from the Atlantic, determined the magnitude of the events that we experienced.
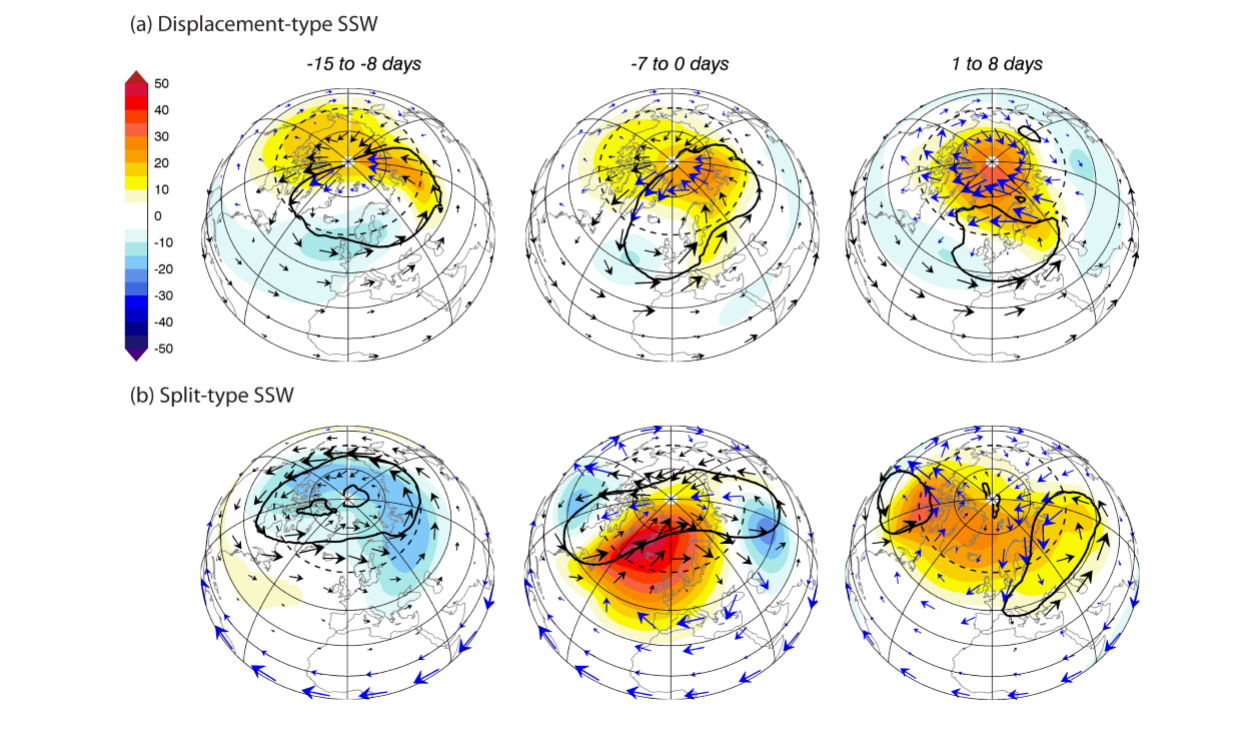
Figure 3. ERA-Interim temperature anomalies and circulation for a) displacement and b) split of the SSW. Source: Butler et al., 2014.
When Emma met The Beast
At the beginning of the last week, the Polar Front was clearly distinguishable in the North Atlantic, as a north-south band just west of Europe (figure 4, top panel). This Front acted as a frontier between systems with different characteristics situated on both sides of it.
In the air mass satellite images cold air masses are represented by blue, while the warm ones appear in green. As the week advances the Front moves northward and it is influenced later by the cold air mass situated over Scandinavia, which forces it further into the Atlantic (figure 4, top right). As the low pressure system over the west of the Iberian Peninsula, named Emma by the Portuguese Meteorological Service, continues its trajectory towards the northeast of Europe, it forces the warm and humid mass from the Atlantic to move also to the northeast (figure 4, bottom panel).
The position of these low and high pressure systems, their trajectories, and the place where both collide, determine the intensity and type of precipitation, the wind, the temperatures, and their magnitudes.
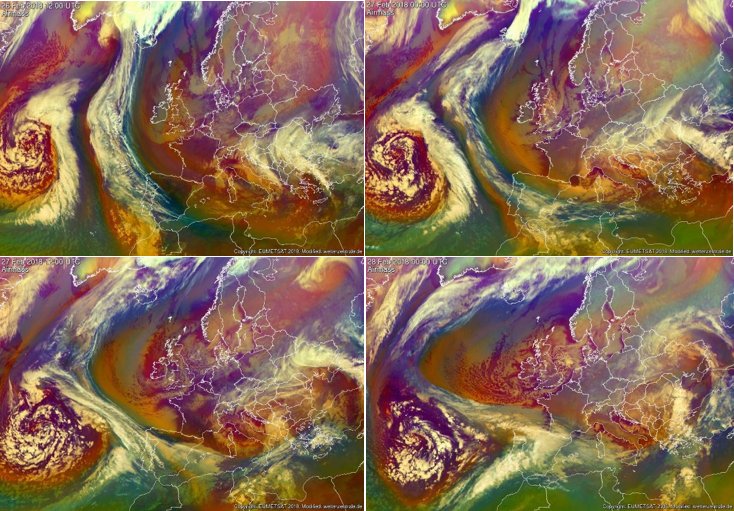
Figure 4. Air mass satellite images for the 26th February 2018 at 12:00 and 00:00 UTC (top panel, from left to right), and for the 27th at 12:00 UTC and the 28th at 00:00 UTC (bottom panel, from left to right). Source: Wetterzentrale.
In figure 5, we examine the atmospheric configuration and its evolution with the output of the models from the European Centre for Medium-Range Weather Forecasts (ECMWF). In the top panel, the shadowed colours represent the geopotential height at 500 hPa. We could say that this is the altitude in the atmosphere where the pressure is 500 hPa. This is approximately the middle of the atmosphere, around 5,500 m. However, depending on the temperature of the air mass, the 500 hPa level may be lower (cold air that sinks) or higher (warm air that expands) in the atmosphere. A low geopotential height can be observed in this case expanding from central Europe and that continued its way down to the east reaching Ireland and the United Kingdom.
In the middle panel of figure 5, the pressure (contours) and the temperature (shading) at 850 hPa (1,500 m approximately) are presented. The bottom panel of the same figure, shows the wind direction (stream lines) and intensities (shading). In the high pressure over Scandinavia, wind flow moves in an anti-clockwise direction, bringing the Beast, the cold and dry air, towards Ireland. Southwest of the Iberian Peninsula, Emma moved in a northeast direction, to be finally located in the Bay of Biscay on Thursday morning. There is little change in its position for the rest of the day as well as on Friday, staying south of Ireland.
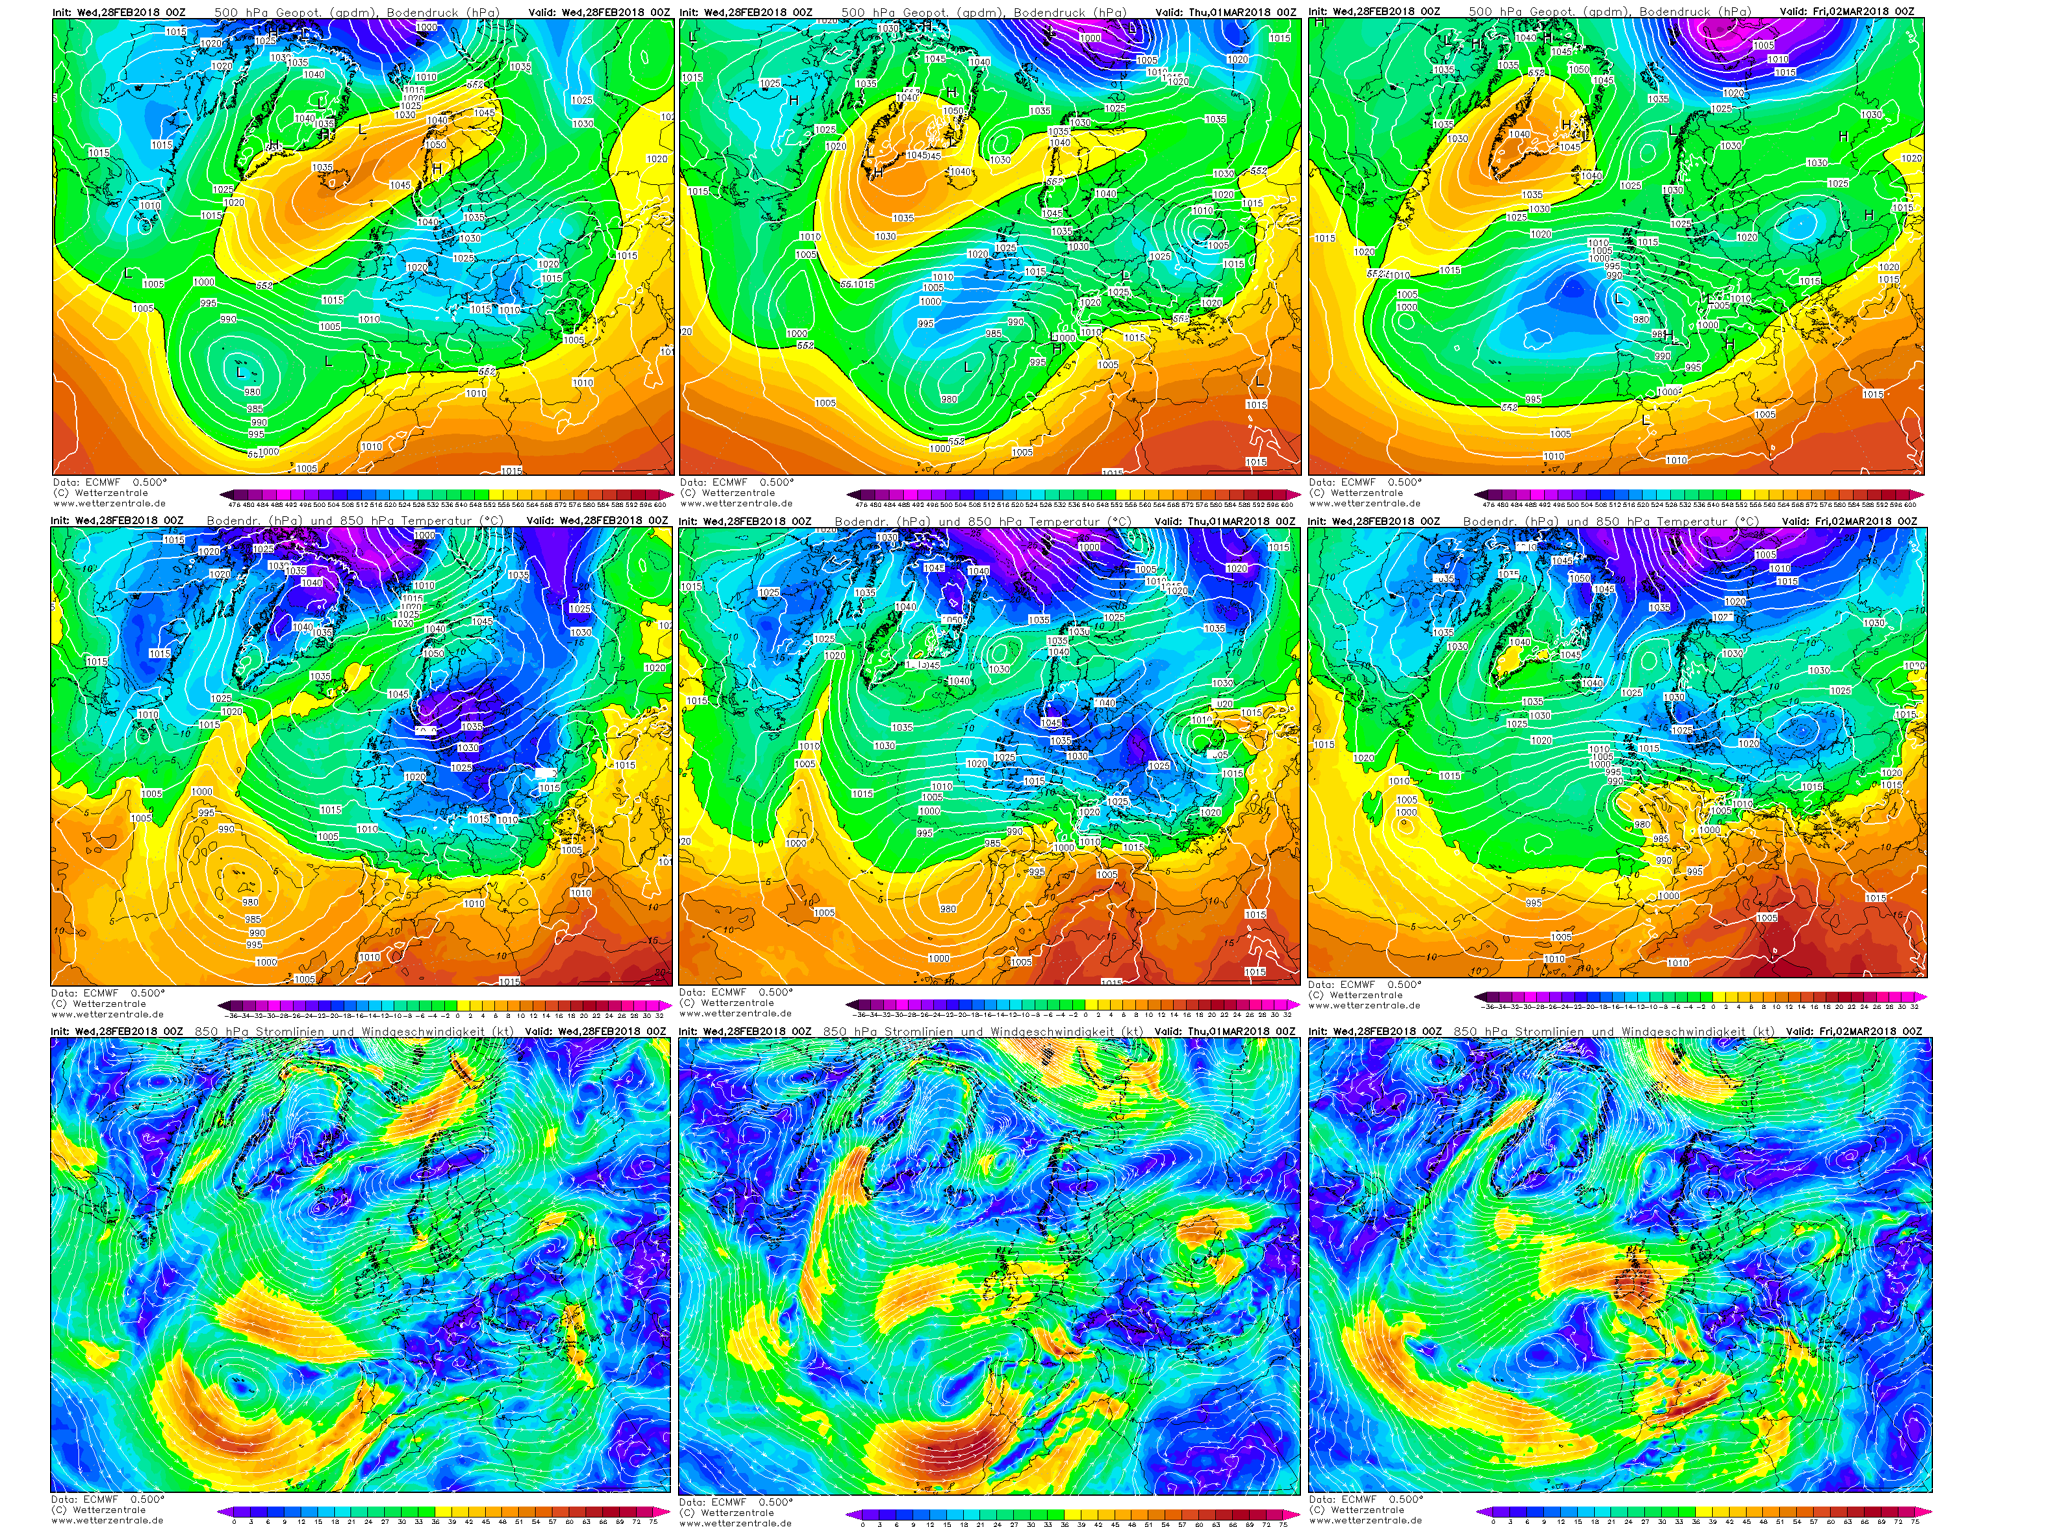
Figure 5. Forecast from the model of the ECMWF. Top panels, geopotential height at 500 hPa (shading) and surface pressure (contours) from Wednesday to Friday at 00:00 UTC. Middle panels, temperature at 850 hPa (shading) and surface pressure (contours). Bottom panel, direction (stream lines) and intensity (shading) of the wind (in knots). Source: Wetterzentrale.
Wind starts blowing from the northeast, changing to east and southeast as Emma approaches Ireland. The progression of the cold temperatures from the east can also be seen in the middle panel of figure 5, as well as the warmer temperatures of the air mass that accompanies Emma and that finally met the Beast.
The convergence of both of these air masses with opposite characteristics, results in precipitation due to the contribution of Emma with the warm and humid air from the Atlantic. However, the cold temperatures associated with the Beast turns this precipitation into snow.
Furthermore, due to the collision of the two different air masses, the temperature changes drastically in a very short distance in the atmosphere, promoting high intensity winds over Ireland and the United Kingdom. This can be seen by the proximity of the lines of the surface pressure (figure 5). The closer they are, the higher the intensity of the winds expected, due to a stronger gradient of temperature. These winds are called gales, a wind with a speed between 34 and 40 knots (around 63 to 74 km/h) (Beaufort scale wind force 8) (WMO, 1992).
And so, the gale accompanied the snow. The result was blizzards, defined by the WMO as a violent winter storm lasting at least 3 hours, which combines below freezing temperatures and very strong wind laden with blowing snow that reduces visibility to less than 1 km (WMO, 1992).
This situation can last for days or weeks, due to a blocking situation as a result of the persistence location of the high pressure system over Scandinavia and so, providing a continuous source of cold air form the east. Moreover, the southward displacement of the trajectory of the storms in the Atlantic, will continue providing a cluster of low pressure systems that will influence Ireland in the next days, bringing more rainfall.
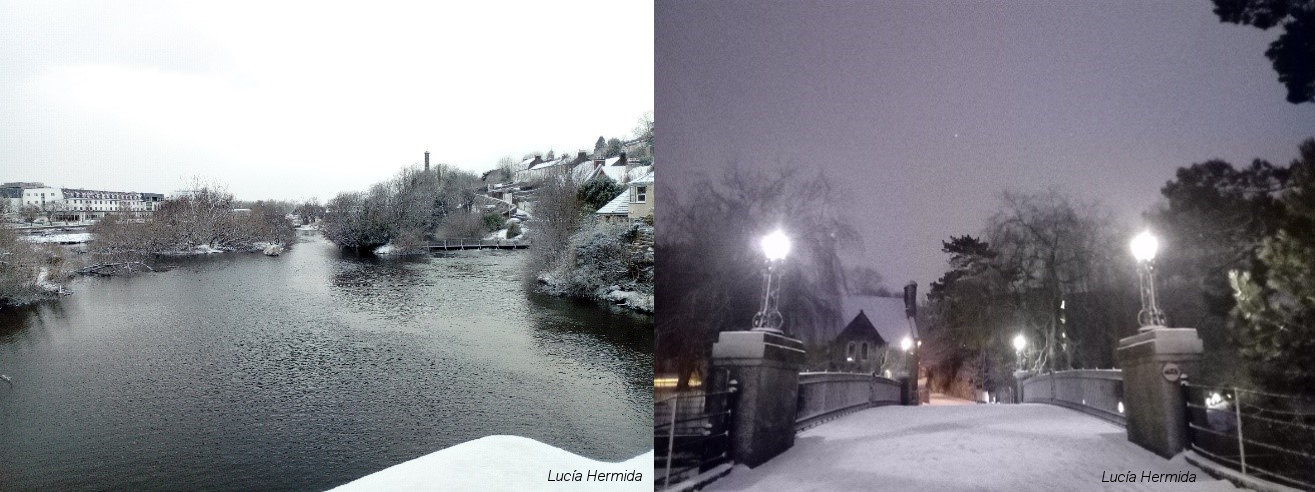
Figure 6. Left, Wellington Bridge (Cork) on Wednesday morning, 28th February, after the first showers of snow. Right, bridge in the Main Gate of UCC campus on Wednesday evening.
Around 12:00 on Friday morning, the low pressure situated just south of Ireland (Emma), together with the cold air from the east (figure 7) continues to give us snow during most of the rest of the day (figure 8).
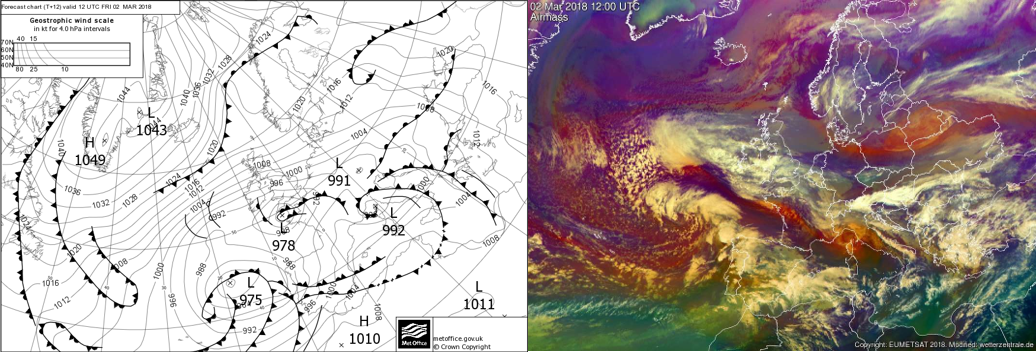
Figure 7. Surface pressure chart forecast for Friday 2nd at 12:00 UTC (left image). Low pressure centre (aka Emma) indicated with L Source: Met Office. Air mass satellite image observed for the same time and day (right image). Source: Wetterzentrale.
Figure 8. Weather Research and Forecasting (WRF) model showing the different types of precipitation, from 02:00 on Friday to 00:00 on Saturday. Pink and red colours represent snow. Source: Meteociel.
If the decrease of the sea ice in the Arctic continues due to anthropogenic climate change, together with the increased mean global temperatures that attenuates the gradient between the equator and the pole, it is highly probable that the mid latitudes (where Ireland is) will experience more events like this one during the winter. Now that the debate is open, further discussion and research need to be carried out.
REFERENCES
- Butler, A.H., Seidel, D.J., Hardiman, S.C., Butchart, N., Birner, T. and Match, A. (2015). Defining sudden stratospheric warmings. Bulletin of the American Meteorological Society, 96(11), pp.1913-1928.
- Hickey, K. (2011). The historic record of cold spells in Ireland. Irish Geography, 44(2-3), pp.303-321.
- Met Éireann (2018). What is a sudden stratospheric warming (SSW)? [Accessed 27th Feb. 2018].
- Watts, J. (2018). Arctic warming: scientists alarmed by ‘crazy’ temperature rises. [Accessed 27th Feb. 2018].
- WMO (1992). International meteorological vocabulary. WMO/OMM/IMGW, No. 182, Geneva.
- WMO CAS (1978). Abridged final report of the seventh session, Manila, 27 February–10 March 1978. Secretariat of the WMO Rep. WMO-509, 113 pp.
ClimATT
Climate Change Attribution of Extreme Weather Events
Contact us