Overview
The detection of trace gases and their isotopologues requires the development of highly sensitive and selective methods. To this end joint funding has been awarded in the form of a joint Government of Ireland Postgraduate (GOIPG) grant by Research Ireland (formerly Irish Research Council) and the Environmental Protection Agency (EPA).
In recent years, applications using two phase-coherent frequency combs have attracted great interest in the field of molecular spectroscopy and trace gas sensing. In Dual Comb Spectroscopy (DCS) two frequency combs produce a time-dependent interferogram on a detector after passing through a gas sample. This interferogram can be Fourier transformed to extract high resolution optical spectra using a single photodetector. Using DCS in conjunction with optical cavities for enhanced absorption sensitivity, however, has proven challenging due to the difficulties in matching frequency combs to the mode structure of high finesse cavities, which requires stable active electronic locking schemes.
Dual Cavity Dual Comb Interferometry (DC-COIN)
In contrast DC-COIN is a novel method using a high intensity broadband incoherent light source to generate interferograms analogous to DCS by combining the light transmitted by two stable optical cavities with slightly different free spectral ranges. It enables a spectrum to be obtained with a single detector, with high resolution and high sensitivity. A schematic of an experimental setup is shown in Figure 1.
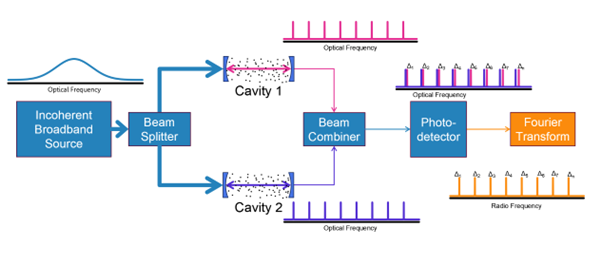
Fig. 1. Schematic of the experimental setup. In the experiments performed, the cavities consisted of pairs of mirrors with R = 0.9997 and a length of ~50 cm.
Recently the detection of CO2, C2H2 and atmospheric water vapour has been demonstrated with a resolution of ~306 MHz using a superluminescent light emitting diode, bandpass filter and an erbium doped fiber amplifier. The setup has no moving parts and is tunable in the range of 1540-1560nm. Examples of typical beat spectra are shown in Figures 2 and 3.
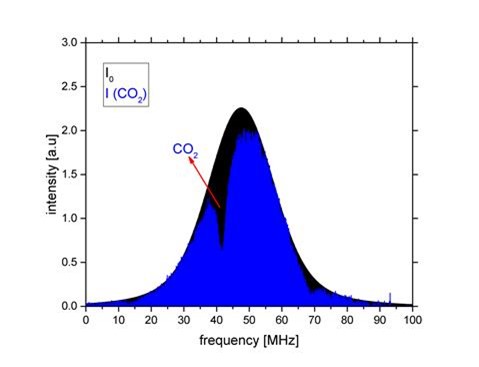
Figure 1. Beat spectrum recorded using DC-COIN on a relative frequency axis, highlighting CO2 absorption (blue trace, I). The black trace represents the envelope of the beat spectrum without a sample (I₀); its shape was obtained through a fit with a Voigt profile.
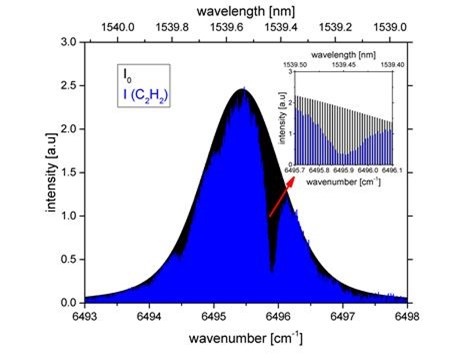
Figure 2. Spectrum recorded using DC-COIN on a calibrated wavenumber axis, highlighting C2H2 absorption (see blue trace). The black trace represents the envelope of the beat spectrum without a sample (I₀); its shape was obtained through a fit with a Voigt profile. The inset shows the corresponding magnified beat spectra between 6495.7 cm-1 and 6496.1 cm-1, displaying individual comb teeth.
Laser Spectroscopy Group
Contact us
Room 118, 1st floor, Kane Building, School of Physics, University College Cork, Ireland,