Explore the background science of wildfires on this page
Wildfires in Ireland
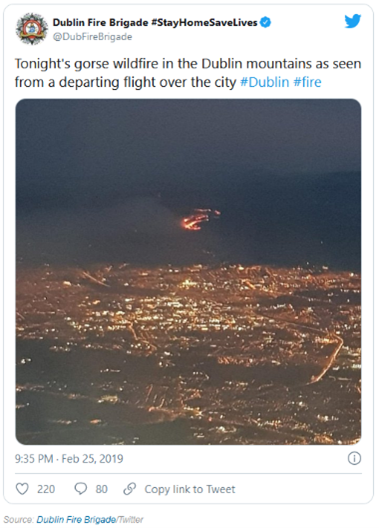
In Ireland, wildfires are commonly associated with periods of dry weather, and may be started accidentally or as a result of controlled burns which become uncontrolled. To limit the number of such uncontrolled burn events, setting fire to vegetation is prohibited between March 1st and August 31st each year. But even outside the window of illegal burning, large wildfires can occur, e.g., the large Dublin Mountains and Wicklow Mountains gorse fires in February 2019 [1], [2].
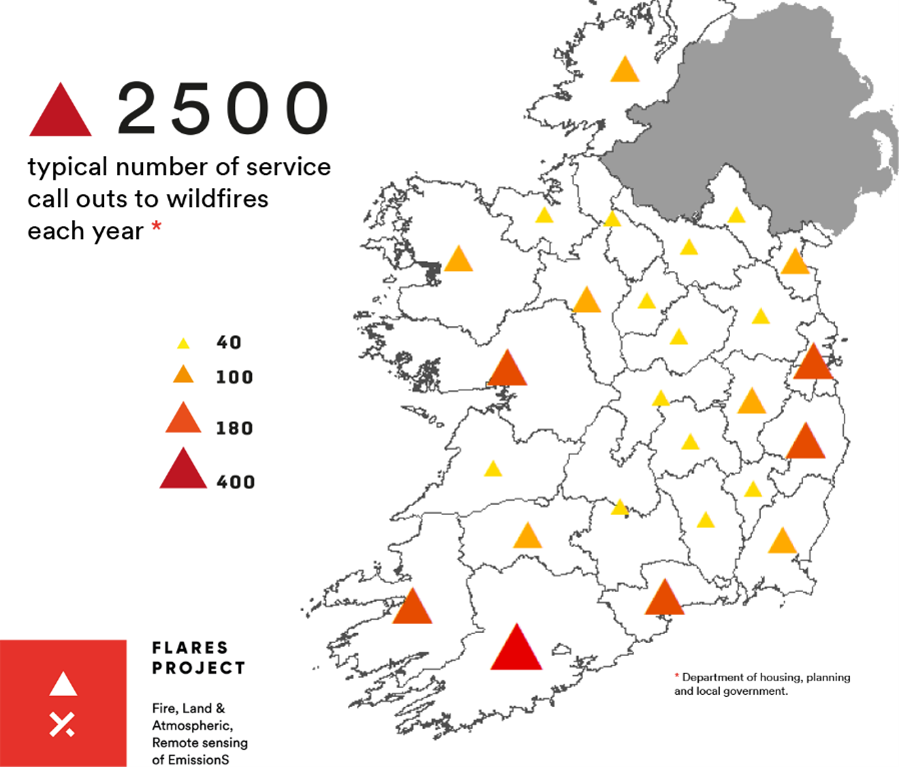
In 2016, the last year for which statistics are available with respect to fire call outs, 2471 events were recorded in the forest/bog/grass, etc. category [3]. The limitations of reported fire data include incompleteness, inconsistency in reporting of extent and nature of burn, and a lack of timeliness.
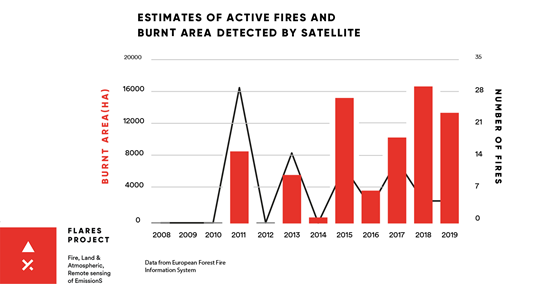
Additional data on fire alerts are drawn from international satellite remote sensing programmes to produce a more consistent national summary, and, according to the latest available whole year report, in 2017 most activity occurred in April and May with a number of very large fires, mainly in western regions. Based on satellite image analysis, the Department for Agriculture, Forestry and the Marine (DAFM) estimated that nationally 1,500ha of forest land and 10,400ha of non-forest land was burned [4]. The Global Forest Fires Watch [5], which draws information from MODIS, indicates 1,034 fire alerts from 13th June 2018 to 12th June 2019. However, these figures must be interpreted cautiously; a large fire covering multiple pixels will be recorded as multiple fires, and each satellite overpass shows a new alert. Thus, many 10s of fire alerts could refer to just 2-3 separate fires.
Since January 2001, 31% of the fires are recorded in areas internationally recognised for their role in conserving species and ecosystems [6], which corresponds to 10,127 km2 of the Irish landmass, including 165 areas protected under the EU Birds Directive and 439 areas protected under the EU Habitats Directive.
With a dedicated satellite remote sensing program, in conjunction with species-specific emission factors, more accurate and up-to-date greenhouse gas (GHG) and air pollutant inventories can be produced, along with enhanced knowledge of the location and environmental and human impacts of uncontrolled upland fires.
- Rónán Duffy, “Firefighters battle gorse fire in Dublin Mountains and UK records hottest February day ever,” TheJournal.ie, 25-Feb-2019. [Online]. Available: https://www.thejournal.ie/dublin-mountains-gorse-fire-4512948-Feb2019/. [Accessed: 25-Jun-2019];
- Peter Farrell, “Air Corps on standby to deal with further wildfires,” RTE, 27-Feb-2019. [Online]. Available: https://www.rte.ie/news/leinster/2019/0227/1033274-wildfire/. [Accessed: 25-Jun-2019];
- Department of Housing, Planning, and Local Government, “Fire Service statistics,” Fire Service statistics, 2016. [Online]. Available: https://www.housing.gov.ie/community/fire-and-emergency-management/other/statistics. [Accessed: 25-Jun-2019];
- San-Miguel-Ayanz, J et al. (2018). Forest fires in Europe, Middle East and North Africa 2017. 10.2760/663443;
- World Resources Institute, “Global Forest Watch Fires,” Global Forest Watch, 2019. [Online]. Available: https://fires.globalforestwatch.org/home/. [Accessed: 25-Jun-2019;
- International Union for Conservation of Nature, “World Database on Protected Areas,” IUCN, International Union for Conservation of Nature, 2019. [Online]. Available: https://www.iucn.org/theme/protected-areas/our-work/world-database-protected-areas. [Accessed: 27-Jun-2019];
Information on wildfire events from satellite remote sensing
Fire Disturbance has been identified as an Essential Climate Variable (Mason et al., 2010), and data on burned area has been identified by both the United Nations Framework Convention and the Intergovernmental Panel on Climate Change as important both as an indicator of changes in climate (e.g. vegetation becoming drier and more combustible) and as a contributor to climate change (e.g. release of greenhouse gases resulting from burning of vegetation) (Hawbaker et al.,2017).
Earth Observation satellite sensors have been acquiring synoptic information on the planetary surface and atmosphere since the second half of the 20th century, including detection of live fire events and burned areas. A paper using satellite data for burned area mapping (Hitchcock and Hoffer, 1974) was first released only two years after the launch of the first Landsat satellite in 1972 (Chuvieco et al., 2019). Since the 1970s a large number of research outputs (including peer-reviewed journal papers, book chapters, conference presentations, and project reports) have described the use of satellite images for burned area detection and mapping. Despite this, remote sensing of burned areas is still an active research field, with developments in sensors, techniques, algorithms and products enabling more accurate and timely identification of burned areas.
Physical principles of mapping burned areas | Selected sensors for fire disturbance | Indices and methods to detect and map fires and burned areas | Available products - advantages and limitations | Conclusion | References
 The underlying physical principles of mapping burned areas from satellite Earth observation.
A lot of different parameters influence the impact of fire on vegetation, and consequently its manifestation on satellite images. The post-fire signal and its difference with respect to the pre-fire reflectance, temperature or backscatter tend to differ from one fire to another, and from one environment to another (Chuvieco et al., 2019). The type of fire, its behaviour and the interval between the extinction of a fire and the acquisition of an image have consequences on the signals that can be identified on satellite images. The principal spectral components of recent burn scars are charcoal and ash, but depending on the fire regime, its intensity and length, leaves or vegetation can remain at the surface (Chuvieco et al., 2019). Burn scars lose the ash and charcoal signal at different rates depending on the primary productivity at the site and the nature of the vegetation recovery (Boschetti et al., 2015). When the ash and charcoal signal disappears, the biomass lost, and potentially different vegetation assemblage, are the only parameters that allow discrimination of burned areas (Chuvieco et al., 2006).
In the optical region of the electromagnetic spectrum, several wavelength regions are sensitive to fire occurrences and post-fire signals. Active fire signals can show an increase of Shortwave Infrared (SWIR) radiance (Chuvieco et al., 2019), but the middle infrared (MIR) and thermal infrared (TIR) domain are primarily used for detection ongoing burn events (Matson et al., 1984). The contrast in MIR and TIR radiances have been later used to discriminate active fires from their background (Chuvieco et al., 2019). The Near Infrared (NIR) and SWIR spectral regions are the most sensitive regarding fire effects after the burn event is over (Pleniou and Koutsis, 2013). After the occurrence of a vegetation fire, leaf pigmentation changes and water content is considerably reduced. These phenomena result in a strong decrease of the NIR reflectance (Silva et al., 2004) but also in an increase in the SWIR reflectance (Chuvieco et al., 2006). The microwave domain has been mainly used over tropical areas or at high latitudes to compensate for high levels of cloud cover or low sun angles degrading optical satellite images (Goodenough et al., 2011). Different techniques have been developed using Synthetic Aperture Radar (SAR) data to estimate fire impacts, but the best results are achieved using longer wavelengths such as the L-band (Chuvieco et al., 2019). However, their accuracy is reduced in areas of steep topography or high soil moisture (Tanase et al. 2010), and distinguishing between a fire event and another change in land cover such as deforestation can be challenging. The cost and availability of LiDAR data make their use for fire monitoring scarce (McCarley et al., 2017).
The remainder of this review will focus on post-fire identification using visible, NIR, SWIR and microwave wavelengths.
Selected sensors used for Fire Disturbance
Over the last 50 years multiple satellite sensors measuring wavelengths sensitive to fire occurrence and effects have been launched. These sensors are diverse in terms of their spatial, temporal, spectral and radiometric resolutions. The temporal frequency of satellite images is a key parameter regarding identification of burn scars and the recovery of vegetation (Boschetti, 2015). Post-fire surfaces are likely to change rapidly, and additionally multiple date images are often needed to distinguish between disturbances due to fire from other land cover changes due to human activity (e.g. crop harvesting) or natural variation (e.g. seasonal vegetation phenology) (Roy, Jin et al., 2005). The first burned area products were mainly derived from Landsat multispectral scanner (MSS) and TM images at a local scale (Chuvieco et al., 2019). AVHRR and ATSR sensors were later used to map burned areas at a lower spatial resolution of 1km and generate some of the first global products (Simon et al., 2004).
Nowadays most global products rely on high temporal resolution sensors that cover the surface of the Earth at least once per day, with a spatial resolution not higher than 250m. MODIS sensors on the Terra and Aqua platforms were the first environmental satellite sensors with bands selected specifically for their fire monitoring potential (Boschetti, 2015). Global thermal anomaly products indicating active fire events are typically produced at a 1km scale, however both MODIS sensors are reaching the end of their operational lives after over 20 years. In 2011, VIIRS, another sensor with dedicated active fire detection capabilities, was launched on board the Suomi National Polar-orbiting Partnership satellite (Giglio and Csiszar, 2014), and subsequently on the NOAA-20 platform launched in 2017. VIIRS has a spatial resolution of 375m, making it sensitive to smaller fires than MODIS (Briones-Herrera et al., 2020).
Regional or national products have been developed using higher spatial resolution sensors (Chuvieco et al., 2019). These products are mostly based on Landsat (ETM+ on Landsat-7 and OLI on Landsat-8) and Sentinel-2 images from the Multispectral Instrument (MSI). These two missions provide free, easily accessible images in 7-12 spectral channels, with a spatial resolution of 10-30m and a temporal resolution of every few days.
Sentinel-2A was launched in June 2015 and was joined by an identical sensor on Sentinel-2B in March 2017. Since then, the suitability of Sentinel-2 mission for burn area mapping and burn severity discrimination has been investigated in a range of different countries and at different scales. Sentinel-2 MSI instruments are unique in that they record reflectance in a number of red-edge wavelengths. Several case studies explore this characteristic; trying to find the best indices and methods to exploit the capabilities of this new mission. Multiple studies focus on Mediterranean ecosystems, including Spain (Fernandez-Manso et al., 2016; Colson et al., 2018; Garcia-Llamas et al., 2019), Portugal (Brown et al., 2018; Padua et al., 2020) and Italy (De Simone et al., 2020). In most of these cases, the fires are mainly megafires of over 7000 ha. Many studies demonstrate the suitability of Sentinel 2 MSI images to map burn areas (Brown et al., 2018) and discriminate burn severity (Fernandez-Manso et al., 2016). The adequacy of the red-edge bands is highlighted (Fernandez-Manso et al., 2016; Colson et al., 2018) as well as the high spatial resolution (Roteta et al., 2019). Sentinel-2 MSI data are found to slightly outperform Landsat8 OLI data (Garcia-Llamas et al., 2019; Kurnaz, 2020) and were even considered “a more cost-effective approach” than UAV imagery, giving similar results (Padua et al., 2020). However, the temporal resolution of Sentinel-2 acquisitions (approximately 5 days) as well as its dependence on clear skies is a significant limitation, and high spatial resolution mapping algorithms have been shown to be more likely to produce false positives (Filipponi, 2019). The combination of Sentinel-2 with other products, such as Landsat-8 images, has been shown by some to be a solution (Mallinis et al., 2018, Quintano et al., 2018). A fire database was established for sub-Saharan Africa with daily MODIS hotspots used as the input to the burned area algorithm applied to Sentinel-2 imagery, thus allowing smaller fires to be detected with greater precision (Roteta et al., 2019), and approximately 1.8 times more burned area was identified with the combined approach than with MODIS alone. A small number of studies have combined Sentinel-2 MSI with Sentinel-1 SAR data (Brown et al., 2018; Colson et al., 2018).
Sentinel-1A was launched in April 2014 with Sentinel-1B launched in April 2016, with a combined revisit time at the equator of about six days (Brown et al., 2018). The platforms carry a SAR which operates at the C-band frequency (5.405 GHz) with data collected in four exclusive imaging modes to produce different types of products (ESA, 2020). The use of microwave wavelengths enables imagery to be acquired regardless of cloud cover or solar illumination. This characteristic is beneficial for fire related studies, especially in tropical areas characterized by persistent cloud cover (Chuvieco et al., 2019). Obtaining cloud-free images is often a limitation in optical imagery studies as the closer the image to the date of the fire, the more accurate the resulting analysis.
The indices and methods developed to detect and map active fires and burned areas
Building on the physical principles underlying the detection and mapping of burned areas and the available sensors, several indices and methods have been developed. The first developments were based on the Normalized Difference Vegetation Index (NDVI) (Jakubauskas et al., 1990). Others were then based on the NIR-R region; including the Burned Area Index (Chuvieco et al. 2002) and the Global Environmental Monitoring Index (Pinty and Verstraete, 1992). However, the indices that were found to perform best were the ones combining the NIR-SWIR bands. The Normalized Burn Ratio (NBR) and, the difference between the pre- and post-fire images (dNBR), are based on the combination of band 8A (0.86 µm) and band 12 (2.19µm). This index has been used in a variety of contexts (Chuvieco et al., 2019), with multi-temporal approaches typically having lower commission errors associated with dark surfaces, water bodies and shadows (Chuvieco et al., 2019). However, image acquisition for multi-temporal approaches requires that both images are cloud-free, ideally representing the same phenology and moisture content (Quintano et al., 2018), and the fire scar should be far from the edge of the image (Key and Benson, 2006). Given these limitations, a combination of images from different sensors could be considered, with reflectance calibration differences accounted for (Quintano et al., 2018). Given their success, it has been suggested that the discrimination of burn areas and the designation of burn severity using dNBR thresholds has become the reference method (Quintano et al., 2018).
The most common multi-sensor approaches combine thermal anomalies detected from MIR and TIR bands, which are caused by active fires, and reflectance changes in the optical domain attributable to post-fire signals of ashes or biomass loss (Chuvieco et al., 2019). Such thermal anomalies constitute the seeds for potential burned area regions, thus reducing commission errors, while NIR, SWIR and visible bands are used to discriminate actual burned areas and reduce omission errors. These hybrid algorithms have been widely used for many decades and are at the basis of most global burn areas products (Chuvieco et al., 2019), but the low spatial resolution of many thermal instruments causes small scale fires to be overlooked.
The Sentinel-2 MSI is unique amongst recent high spatial sensors in that it records data in the vegetation red-edge spectral region, offering the opportunity to design and test new spectral indices to discriminate burn severity (Filipponi, 2019). Indeed, the most suitable Sentinel-2 MSI spectral indices to discriminate burn areas and burn severity have been shown to be those based on the red-edge region related to chlorophyll content (band 5 0.705µm), and the red-edge region related to variations in leaf structure (band 7, 0.783 µm, or band 8A, 0.86 µm) (Fernández-Manso et al., 2016). The Sentinel-2 Burn Area Index (BAIS2), for example, uses vegetation properties described in the red-edge spectral region as well as the SWIR region (Filipponi, 2019).The dNBR and dNDVI are widely applied to Sentinel-2 imagery, but several studies indicate that the relative dNBR (RdNBR), which normalizes the dNBR with the square root of the pre-fire NBR to account for pre-fire variability in vegetation composition, can outperform them (García-Llamas et al. 2019, Kurnaz, 2020). The red edge chlorophyll index (CIre) is an index used to estimate chlorophyll content, which has also been proven suitable for burn scar detection (Fernández-Manso et al., 2016), and the Relative Burn Ratio (RBR) seems to be a reasonable alternative when the pre-fire biomass is low and variate (Morgan et al., 2014). Conversely, the Mid-Infrared Burned Index (MIRBI) has been shown to be optimal for shrub/scrubland areas (Brown et al., 2018; Roteta et al., 2019). In most cases the final method relies on a combination of indices, and in some instances on classifiers to further discriminate between different classes. The use of classified has been identified by some studies as the method which produces the most accurate burnt area maps (Brown et al., 2018; Colson et al., 2018), however, it is also noted that multi-index methods have the advantage of being significantly quicker to implement (Brown et al., 2018).
A variety of parameters influence the backscattering energy recorded by SARs. These include the vegetation cover structure, the size, shape and orientation of the scatterers within the canopy, the moisture content and the surface roughness. In addition, the SAR data are highly dependent on the sensor’s characteristics and the observation geometry (Imperatore et al., 2017). Fires affect the structure of the vegetation and the moisture content of the scene, and expose soil. Therefore, as with optical images, temporal variations on radar signatures can be exploited to characterize fire impacts. As fires reduce the number of vegetation scattering elements, it has been shown that a decrease in cross-polarised backscattering coefficient can be associated with vegetation burning (Belenguer-Plomer at al., 2019). Increased soil exposure changes the nature of the return to a “complicated mixture of surface and double bounce scattering” (Carreiras et al., 2020) which can be assessed by a variation of co-polarised backscattering coefficients (Imperatore et al., 2017). The Sentinel-1 sensors, being high-temporal, dual-polarisation SAR systems (collecting data in both cross- and co-polarised modes), offer a unique opportunity to detect and map burn scars.
However, these properties are extremely dependent on the ecosystems and weather conditions of the area, forest fires for example can be mapped with a higher accuracy than fires in sparse vegetation areas (Belenguer-Plomer et al., 2019; Filipponi, 2019). C-band SAR-based studies generally show a greater co-polarized backscattering signal in fire-disturbed areas in the wet soil conditions of boreal forests, whereas a lower backscatter was observed for sites with better drainage (Imperatore et al., 2017). Variability in moisture contents due to rain significantly lower the quality of SAR analysis, reducing the C-band sensitivity to changes due to fire events (Tanase et al., 2010; Filipponi, 2019). Thus, while optical data can be used to detect change for a few weeks month after the fire event, SAR data are most relevant immediately after the burning, which can be an important limitation when the date of the fire is not known (Phillipe and Levick, 2019). The steep slopes of mountainous terrain are also problematic to detect burned areas due to geometric distortions in the imagery (Radionova et al., 2016).
Sentinel-1 has been shown to be a valuable tool for mapping burn areas (Carreiras et al., 2020; Johnston et al, 2018). This is especially true in synergistic approaches with optical imagery (Colson et al., 2018), where the incorporation of Sentinel-1 improved results where Sentinel-2 images were unavailable due to cloud cover (Verheggeen et al., 2016). However, it was noted that the addition of Sentinel-1 SAR bands did not have a significant impact in other studies (Brown et al., 2018) due to the complexity of processing and interpreting the imagery, as well as the requirement for knowledge of a fire event with high confidence (Carreiras et al., 2020). Extending these approaches to regional or global scales is challenging given the difficulty in designing methods that can be applied to the large variability of post-fire backscatter signatures between vegetation types as well as meteorological conditions and topographic slopes. In addition, the volumes of microwave data are much greater than those from optical sensors (Carreiras et al., 2020) posing challenges for processing and storing.
The available products: advantages and limitations
Active fires and burned area products are the two types of satellite image datasets supporting fire mapping. Active fire products rely on thermal anomalies detection algorithms and are usually near-real time datasets with observations at least once each day (Briones-Herrera et al., 2020). Active fire products provide information on the location of a thermal anomaly at the time of the satellite overpass (Giglio et al. 2003), which is used to establish a first estimation of burned area, but they also face a number of limitations. Quickly moving fire fronts, small and cool fires, and those that are in persistently cloudy locations may not be sampled correctly (Humber et al., 2019), and the spatial extent of burning cannot be reliably established from this kind of products as they tend to be very low spatial resolution (Boschetti et al., 2015). Nevertheless, based on the presence of an active fire, burned area products can be derived from reflectance changes to estimate the areas that have been affected by a fire (Briones-Herrera et al., 2020). There are many different algorithms for global burned area products available, optimised for the spectral wavelengths acquired by each sensor, leading to disparate results both spatially and temporally (Humber et al., 2019), and most are presented only as monthly composites so cannot be used for near real-time fire monitoring (Chuvieco et al., 2019).
MCD14DL, processed by NASA's Land, Atmosphere Near real-time Capability for EOS (LANCE) Fire Information for Resource Management System (FIRMS) is the most commonly used active fire product. It is a global product with near-real time (NRT) information for each 1 km fire pixel detected by the Terra and Aqua MODIS sensors (Giglio et al., 2018). The NRT active fire product from the VIIRS sensors aboard the joint NASA/NOAA Suomi National Polar-orbiting Partnership (Suomi NPP) and NOAA-20 satellites has a spatial resolution of 375 m. This higher spatial resolution provides greater results for small fires and a better night-time performance than MCD14DL (Schroeder et al., 2014), but unlike the MODIS product which has been available from two platforms for nearly 20 years, the dual platform VIIRS product has only been available since the end of 2019. At present the FIRMS database contains data from four separate platforms, each of which passes over every point on the Earth’s surface at least once every two days, however it is not known for how much longer the MODIS sensors will remain operational.
The first global burned area products were released in the 1990s based on data from the NOAA-AVHRR sensors (Chuvieco et al., 2019). In the early 2000s products were increasingly based on the MODIS sensors and the SPOT-Vegetation sensor. The Terra and Aqua combined MCD64A1 Version 6 Burned Area data product is a monthly, global 500m product. The current mapping algorithm is a hybrid, based on 500m MODIS reflectance to create a burn sensitive vegetation index, and 1km MODIS active fire observations (Giglio et al., 2018). The MODIS products are usually unable to map burns smaller than 100ha (Giglio et al., 2018).
The current Copernicus Burnt Area products are generated from the Proba-V sensor, which succeeds the SPOT-Vegetation sensor. Burns are identified by detecting sudden changes in vegetation index values, with products available at 1km resolution since 1999 for SPOT-Vegetation and 2013 for Proba-V. Both spatial and temporal differences between this and other global products are evident, arising from the different sensor resolutions (Humber et al., 2019). The Copernicus Global Land Service also provides a 10-day composited, 300m burned area global product derived from Proba-V within 3 days of the end of the composite period.
Another European project aimed at developing long term time series of burned areas is the ESA Fire Climate Change Initiative (CCI) project. This project has generated three global burned area products; FireCCI41 is based on 300m resolution MERIS images (from 2005-2011) with the addition of a MODIS hotspots input to detect the most burned pixels, FireCCI50 (2001-2016) and FireCCI51 (2001-2018) use the MODIS 250m bands with the addition of MODIS hotspots with the same purpose.
These three global products have been evaluated by Humber et al. (2019) for the period 2005-2011, with an inter-comparison between them showing that for each calendar year the MODIS MCD64A1 algorithm detected the most burned area, and exceeded the Copernicus total burnt area for the whole period by 90% and the Fire CCI by 25%. The latter were found to particularly suffer from artefacts at the edges of processing tiles (Humber et al. 2019). The results of this study highlight the significant discrepancies between the different global products in terms of the location and timing of fires, and the clear need for standardisation of satellite-derived burned area products and the reporting of their accuracies.
In recognition of the lack of a standard approach to burned area information in Europe, the European Forest Fire Information System (EFFIS) was developed by the European Commission services in 2000. It is a forest fire management system based on remote sensing and geographic information systems (Chuvieco et al., 2019). EFFIS uses the active fire detection provided by the NASA FIRMS to identify ongoing fires, with their perimeters mapped using 250m MODIS and 375m VIIRS imagery across Europe for fires of about 30 ha or larger, two-three times every day. Although only a fraction of the total number of fires is mapped, the area burned by fires in excess of 30 ha represents about 75% to 80% of the total area burned in the EU (https://effis.jrc.ec.europa.eu/).
Conclusion
As highlighted by this review, each satellite fire product is optimised for the characteristics of the data which are its primary inputs, and errors are widespread in most fire related datasets, especially those covering multiple different vegetation and climatic zones. Padilla et al. (2015) stated that commission errors for burned area products ranged between 42 and 94%, and omission errors reached 68 to 93%. Most of the datasets are limited by their coarse spatial resolution, which omit small and fragmented fires, resulting in a need for high spatial resolution burned area products (Boschetti et al., 2015). Knowledge of these smaller fires is essential to improve estimation of atmospheric emissions (Chuvieco et al., 2019), with Filipponni (2019) highlighting the need for “operational services for medium-high wildfire mapping at a national level based on new satellite sensors”. He explains that many studies focus on developing spectral indices, but in order “to provide updated, detailed, and reliable information on wildfires, there is a need to integrate existing operational services (i.e., Copernicus EMS and EFFIS) with new procedures for national level mapping, exploiting the large amount of new Copernicus Sentinel data”. The need to develop approaches at finer spatial resolutions, taking advantage of the spectral and temporal synergies, between Sentinel-2 and Landsat-8 data was also identified by Boschetti et al. (2015) and Briones-Herrera et al. (2020), with the extension of existing algorithms to national and regional scales.
References:
- Belenguer-Plomer, M.A., Tanase, M.A., Fernandez-Carrillo, A., Chuvieco, E., 2019. Burned area detection and mapping using Sentinel-1 backscatter coefficient and thermal anomalies. Remote Sensing of Environment 233, 111345. https://doi.org/10.1016/j.rse.2019.111345
- Boschetti, L., Roy, D.P., Justice, C.O., Humber, M.L., 2015. MODIS–Landsat fusion for large area 30m burned area mapping. Remote Sensing of Environment 161, 27–42. https://doi.org/10.1016/j.rse.2015.01.022
- Briones-Herrera, C.I., Vega-Nieva, D.J., Monjarás-Vega, N.A., Briseño-Reyes, J., López-Serrano, P.M., Corral-Rivas, J.J., Alvarado-Celestino, E., Arellano-Pérez, S., Álvarez-González, J.G., Ruiz-González, A.D., Jolly, W.M., Parks, S.A., 2020. Near Real-Time Automated Early Mapping of the Perimeter of Large Forest Fires from the Aggregation of VIIRS and MODIS Active Fires in Mexico. Remote Sensing 12, 2061. https://doi.org/10.3390/rs12122061
- Brown, A.R., Petropoulos, G.P., Ferentinos, K.P., 2018. Appraisal of the Sentinel-1 & 2 use in a large-scale wildfire assessment: A case study from Portugal’s fires of 2017. Applied Geography 100, 78–89. https://doi.org/10.1016/j.apgeog.2018.10.004
- Carreiras, J.M.B., Quegan, S., Tansey, K., Page, S., 2020. Sentinel-1 observation frequency significantly increases burnt area detectability in tropical SE Asia. Environ. Res. Lett. 15, 054008. https://doi.org/10.1088/1748-9326/ab7765
- Chuvieco, E., Mouillot, F., van der Werf, G.R., San Miguel, J., Tanase, M., Koutsias, N., García, M., Yebra, M., Padilla, M., Gitas, I., Heil, A., Hawbaker, T.J., Giglio, L., 2019. Historical background and current developments for mapping burned area from satellite Earth observation. Remote Sensing of Environment 225, 45–64. https://doi.org/10.1016/j.rse.2019.02.013
- Chuvieco, E., Riaño, D., Danson, F.M., Martin, P., 2006. Use of a radiative transfer model to simulate the postfire spectral response to burn severity: RTM TO SIMULATE BURN SEVERITY. J. Geophys. Res. 111. https://doi.org/10.1029/2005JG000143
- Colson, D., Petropoulos, G.P., Ferentinos, K.P., 2018. Exploring the Potential of Sentinels-1 & 2 of the Copernicus Mission in Support of Rapid and Cost-effective Wildfire Assessment. International Journal of Applied Earth Observation and Geoinformation 73, 262–276. https://doi.org/10.1016/j.jag.2018.06.011
- De Simone, W., Di Musciano, M., Di Cecco, V., Ferella, G., Frattaroli, A.R., 2020. The potentiality of Sentinel-2 to assess the effect of fire events on Mediterranean mountain vegetation. Plant Sociology 57, 11–22. https://doi.org/10.3897/pls2020571/02
- Fernández-Manso, A., Fernández-Manso, O., Quintano, C., 2016. SENTINEL-2A red-edge spectral indices suitability for discriminating burn severity. International Journal of Applied Earth Observation and Geoinformation 50, 170–175. https://doi.org/10.1016/j.jag.2016.03.005
- Filipponi, F., 2019. Exploitation of Sentinel-2 Time Series to Map Burned Areas at the National Level: A Case Study on the 2017 Italy Wildfires. Remote Sensing 11, 622. https://doi.org/10.3390/rs11060622
- García-Llamas, P., Suárez-Seoane, S., Fernández-Guisuraga, J.M., Fernández-García, V., Fernández-Manso, A., Quintano, C., Taboada, A., Marcos, E., Calvo, L., 2019. Evaluation and comparison of Landsat 8, Sentinel-2 and Deimos-1 remote sensing indices for assessing burn severity in Mediterranean fire-prone ecosystems. International Journal of Applied Earth Observation and Geoinformation 80, 137–144. https://doi.org/10.1016/j.jag.2019.04.006
- Giglio, L., Boschetti, L., Roy, D.P., Humber, M.L., Justice, C.O., 2018. The Collection 6 MODIS burned area mapping algorithm and product. Remote Sensing of Environment 217, 72–85. https://doi.org/10.1016/j.rse.2018.08.005
- Giglio, L., Descloitres, J., Justice, C.O., Kaufman, Y.J., 2003. An Enhanced Contextual Fire Detection Algorithm for MODIS. Remote Sensing of Environment 87, 273–282. https://doi.org/10.1016/S0034-4257(03)00184-6
- Goodenough, D.G., Chen, H., Richardson, A., Cloude, S., Hong, W., Li, Y., 2012. Mapping fire scars using Radarsat-2 polarimetric SAR data 37, 11.
- Hawbaker, T.J., Vanderhoof, M.K., Beal, Y.-J., Takacs, J.D., Schmidt, G.L., Falgout, J.T., Williams, B., Fairaux, N.M., Caldwell, M.K., Picotte, J.J., Howard, S.M., Stitt, S., Dwyer, J.L., 2017. Mapping burned areas using dense time-series of Landsat data. Remote Sensing of Environment 198, 504–522. https://doi.org/10.1016/j.rse.2017.06.027
- Humber, M.L., Boschetti, L., Giglio, L., Justice, C.O., 2019. Spatial and temporal intercomparison of four global burned area products. International Journal of Digital Earth 12, 460–484. https://doi.org/10.1080/17538947.2018.1433727
- Imperatore, P., Azar, R., Calo, F., Stroppiana, D., Brivio, P.A., Lanari, R., Pepe, A., 2017. Effect of the Vegetation Fire on Backscattering: An Investigation Based on Sentinel-1 Observations. IEEE J. Sel. Top. Appl. Earth Observations Remote Sensing 10, 4478–4492. https://doi.org/10.1109/JSTARS.2017.2717039
- Johnston, A., Millin-Chalabi, G., Quincey, D., n.d. Identifying and characterising UK upland wildfires using Sentinel-1 radar 2.
- Kurnaz, B., Bayik, C., Abdikan, S., 2020. Forest Fire Area Detection by Using Landsat-8 and Sentinel-2 Satellite Images: A Case Study in Mugla, Turkey (preprint). In Review. https://doi.org/10.21203/rs.3.rs-26787/v1
- Mallinis, G., Mitsopoulos, I., Chrysafi, I., 2018. Evaluating and comparing Sentinel 2A and Landsat-8 Operational Land Imager (OLI) spectral indices for estimating fire severity in a Mediterranean pine ecosystem of Greece, GIScience and Remote Sensing, 55:1, 1-18 https://doi.org/10.1080/15481603.2017.1354803
- Mason, P., Zillman, J., Simmons, A., Lindstrom, E., Harrison, D., Dolman, H., Bojinski, S., Fischer, A., Latham, J., Rasmussen, J., 2010. Implementation plan for the global observing system for climate in support of the UNFCCC (2010 Update).
- Matson, M., Schneider, S.R., Aldridge, B., Satchwell, B., 1984. Fire Detection Using the NOAA—Series Satellites 42.
- McCarley, T.R., Kolden, C.A., Vaillant, N.M., Hudak, A.T., Smith, A.M.S., Wing, B.M., Kellogg, B.S., Kreitler, J., 2017. Multi-temporal LiDAR and Landsat quantification of fire-induced changes to forest structure. Remote Sensing of Environment 191, 419–432. https://doi.org/10.1016/j.rse.2016.12.022
- Morgan, P., Keane, R.E., Dillon, G.K., Jain, T.B., Hudak, A.T., Karau, E.C., Sikkink, P.G., Holden, Z.A., Strand, E.K., 2014. Challenges of assessing fire and burn severity using field measures, remote sensing and modelling. Int. J. Wildland Fire 23, 1045. https://doi.org/10.1071/WF13058
- Pádua, L., Guimarães, N., Adão, T., Sousa, A., Peres, E., Sousa, J.J., 2020. Effectiveness of Sentinel-2 in Multi-Temporal Post-Fire Monitoring When Compared with UAV Imagery. IJGI 9, 225. https://doi.org/10.3390/ijgi9040225
- Philipp, M.B., Levick, S.R., 2019. Exploring the Potential of C-Band SAR in Contributing to Burn Severity Mapping in Tropical Savanna. Remote Sensing 12, 49. https://doi.org/10.3390/rs12010049
- Pleniou, M., Koutsias, N., 2013. Sensitivity of spectral reflectance values to different burn and vegetation ratios: a multi-scale approach applied in a fire affected area. ISPRS J.
- Quintano, C., Fernández-Manso, A., Fernández-Manso, O., 2018. Combination of Landsat and Sentinel-2 MSI data for initial assessing of burn severity. International Journal of Applied Earth Observation and Geoinformation 64, 221–225. https://doi.org/10.1016/j.jag.2017.09.014
- Rodionova, N.V., 2016. Evaluation of Sentinel 1 imagery for burned area detection in southern Siberia in spring and summer 2015. CPRSES 13, 164–175. https://doi.org/10.21046/2070-7401-2016-13-2-164-175
- Roteta, E., Bastarrika, A., Padilla, M., Storm, T., Chuvieco, E., 2019. Development of a Sentinel-2 burned area algorithm: Generation of a small fire database for sub-Saharan Africa. Remote Sensing of Environment 222, 1–17. https://doi.org/10.1016/j.rse.2018.12.011
- Roy, D.P., Jin, Y., Lewis, P.E., Justice, C.O., 2005. Prototyping a global algorithm for systematic fire-affected area mapping using MODIS time series data. Remote Sensing of Environment 97, 137–162. https://doi.org/10.1016/j.rse.2005.04.007
- Schroeder, W., Oliva, P., Giglio, L., Csiszar, I.A., 2014. The New VIIRS 375m active fire detection data product: Algorithm description and initial assessment. Remote Sensing of Environment 143, 85–96. https://doi.org/10.1016/j.rse.2013.12.008
- Silva, J.M.N., Cadima, J.F.C.L., Pereira, J.M.C., Grégoire, J.-M., 2004. Assessing the feasibility of a global model for multi-temporal burned area mapping using SPOT-VEGETATION data. International Journal of Remote Sensing 25, 4889–4913. https://doi.org/10.1080/01431160412331291251
- Simon, M., 2004. Burnt area detection at global scale using ATSR-2: The GLOBSCAR products and their qualification. J. Geophys. Res. 109, D14S02. https://doi.org/10.1029/2003JD003622
- Tanase, M.A., Santoro, M., de la Riva, J., Prez-Cabello, F., Le Toan, T., 2010. Sensitivity of X-, C-, and L-Band SAR Backscatter to Burn Severity in Mediterranean Pine Forests. IEEE Trans. Geosci. Remote Sensing 48, 3663–3675. https://doi.org/10.1109/TGRS.2010.2049653
- Verhegghen, A., Eva, H., Ceccherini, G., Achard, F., Gond, V., Gourlet-Fleury, S., Cerutti, P., 2016. The Potential of Sentinel Satellites for Burnt Area Mapping and Monitoring in the Congo Basin Forests. Remote Sensing 8, 986. https://doi.org/10.3390/rs8120986
Monitoring and Quantification of Emissions using Remote Sensing Products
Satellite imagery is valuable when monitoring and quantifying emissions, as they offer more extensive spatial information than ground observations. However, there are some downsides to using satellite observations such as clouds and smoke preventing consistent observations over time, low spatial and temporal resolution of many satellite products making it hard to pinpoint the location and duration of a fire (Langmann et al. 2009). To address these issues, the Copernicus programme has included three missions dedicated to monitoring the atmosphere and providing their atmosphere monitoring service (CAMS) with additional data for more accurate products. In 2017 the first of the three missions was initiated with the launch of the Sentinel 5-precursor (5p) satellite, carrying the TROPOspheric Monitoring Instrument (TROPOMI). The main goal of this mission is to measure the atmospheric composition with a relatively high spatio-temporal resolution and use these measurements for air quality, ozone, UV radiation, and climate monitoring and forecasting (Sentinel-5P 2020). In the future, the Sentinel 4 and 5 missions will be providing observations of various atmospheric constituents at a spatial resolution of 8 km. Additionally, Sentinel 4, which is expected to be launched in 2023, will be a geostationary satellite, allowing for hourly observations (ECMWF 2019).
Since becoming operational, the Sentinel-5p mission has allowed global mapping of pollutants such as methane (CH4), nitrogen dioxide (NO2 )and carbon monoxide (CO) at a spatial resolution of around 7 by 7 kilometres on a daily basis (Hu et al. 2018, Borsdorff et al. 2018, Griffin et al. 2019). These improvements allow for analyses of pollution levels on a local level or related to specific events. Apart from the Sentinel-5p, there are various other remote sensing products available that allow for the analysis, monitoring and quantification of emissions in the atmosphere, such the MODerate resolution Imaging Spectroradiometer (MODIS) instruments aboard NASA’s Aqua and Terra satellites, the Measurement of Pollution in the Troposphere (MOPITT) instrument aboard the Terra satellite, the Ozone Monitoring Instrument (OMI) aboard the NASA Aura spacecraft, the Cloud-Aerosol Lidar with Orthogonal Polarization (CALIOP) instrument onboard the CALIPSO satellite and the Greenhouse gases Observing Satellite (GOSAT) (Yumimoto et al. 2014, Lin et al. 2015, Parker et al. 2016, Chen et al. 2017). These products are commonly used for monitoring fires, as well as fire-related emissions. However, estimation of emissions is a complicated task with a high degree of uncertainty, as there are many influencing factors such as land cover type, fuel moisture, atmospheric and meteorological conditions (Langmann et al. 2009, Di Giuseppe et al. 2017a). The MODIS sensors are perhaps one of the most influential remote sensing instruments when it comes to monitoring worldwide fire activity. For more than a decade fire products have been derived using MODIS instruments, with continuously improving fire detection algorithms. It is important to note that because of cloud cover, the moderate spatial resolution of the observations and the revisiting time of the satellites, some fires are not registered by the sensors.
Even though it is challenging to quantify fire emissions based on remote sensing products, various studies have been able to book good results. Silva & Arellano (2017), for example, analysed the NO2 observations for the tropospheric column, the CO2 column observations from GOSAT and the CO total column measurements from MOPITT to identify characteristic emission patterns related to wildfires. They found that typically smouldering fires lead to higher levels of CO emissions, while intense flaming fires were characterized by a strong increase in NO2 concentrations. However, due to limited suitable observations for CO2, no increase in CO2 concentration levels was detected in relation to fire events. Another example comes from Kaskaoutis et al. (2014), who assessed the impact of crop burning in Northern India in 2012 using a mixture of ground-based measurements and OMI’s Aerosol Index and tropospheric NO2 concentration levels, as well as the MODIS’ aerosol optical depth measurements. They were able to attribute increases in NO2 and PM2.5 concentration levels to the presence of fire events but noted that many factors influenced fire emissions, such as meteorological conditions and chemical processes which caused irregularities in the observations. Furthermore, the presence of other emission sources, such as urban/ industrial areas, power plants and dust being transported by the wind should be considered. The final example is a study performed by Parker et al. (2016), who analysed GOSAT satellite observations over Indonesia and concluded that peaks in fire activity resulted in large increases of total column CH4 and CO2 concentrations on a regional scale, with particular enhancements because of the extensive smouldering of many peatland fires.
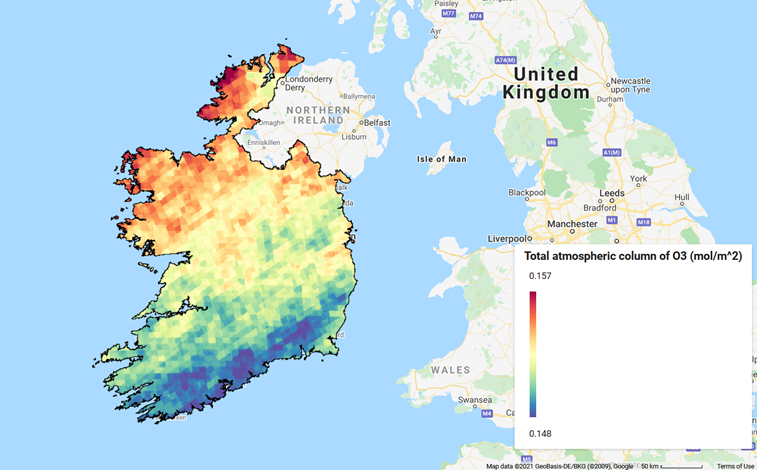
Map showing the average total atmospheric column of ozone derived from Sentinel-5P data between the surface and the top of atmosphere between the first and second of June of 2019.
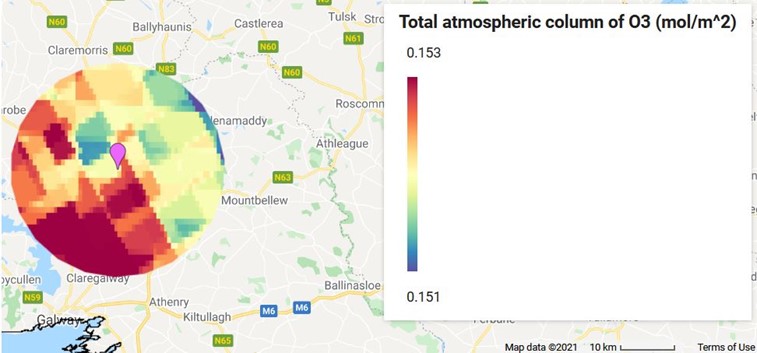
Map showing the average for the Sentinel-5p derived total atmospheric column of ozone between the surface and the top of atmosphere between the 13th and 18th of May 2019 within a 25km radius of a fire event (purple marker) that was reported by the Suomi NPP instrument on the 14th of May 2019.
Copernicus Atmosphere Monitoring Service
The Copernicus Atmosphere Monitoring Service (CAMS), managed by the European Centre for Medium-Range Weather Forecasts (ECMWF), is one of six thematic services belonging of Copernicus, the European Union’s earth observation programme. Within the Copernicus framework, CAMS is the thematic service that provides a variety of data products related to air quality, emissions, solar radiation and surface fluxes (Peuch et al. 2018). The CAMS has an extensive data catalogue offering data products on a global scale, as well as regional data products focused solely on the European continent. CAMS data are modelled data that incorporate information from ground observations and satellites. For the determination of the baseline concentration range and anomaly detection within the Flares project, the analysis dataset of the CAMS European air quality forecasts and analysis was selected. This product was deemed the most suitable because of its relatively high spatial resolution of around ten by ten kilometres and high temporal resolution as the product provides data on an hourly basis. More information about this dataset can be found here: https://ads.atmosphere.copernicus.eu/cdsapp#!/dataset/cams-europe-air-quality-forecasts?tab=overview
Hourly concentrations of sulfur dioxide (SO2) over the Wicklow mountains area in the period 27 June to 1 July 2018. This data was extracted from the CAMS. The red and blue dots represent fires that were detected in satellite data (FIRMS) or that were reported in the media. Click on the image to start the animation.
Bibliography
- About Copernicus (2020). URL: https://www.copernicus.eu/en/about-copernicus Accessed 10 Nov. 2020.
- Borsdorff, T., Aan de Brugh, J., Hu, H., Aben, I., Hasekamp, O. & Landgraf, J. (2018), ‘Measuring carbon monoxide with tropomi: First results and a comparison with ecmwf ifs analysis data’, Geophysical Research Letters 45(6), 2826-2832.
- Chen, J., Li, C., Ristovski, Z., Milic, A., Gu, Y., Islam, M. S., Wang, S., Hao, J., Zhang, H., He, C. & et al. (2017), ‘A review of biomass burning: Emissions and impacts on air quality, health and climate in China.’, The Science of the Total Environment 579, 1000-1034.
- Di Giuseppe, F., Remy, S., Pappenberger, F. & Wetterhall, F. (2017a), ‘Combining fire radiative power observations with the fire weather index improves the estimation of fire emissions’, Atmospheric Chemistry and Physics Discussions p. 1-16.
- ECMWF (2019),CAMS: Development of regional air quality modelling and data assimilation aspects.
- Griffin, D., Zhao, X., McLinden, C. A., Boersma, F., Bourassa, A., Dammers, E., Degenstein, D., Eskes, H., Fehr, L., Fioletov, V. & et al. (2019), ‘High-resolution mapping of nitrogen dioxide with tropomi: First results and validation over the canadian oil sands’, Geophysical Research Letters 46(2), 1049-1060.
- Hu, H., Landgraf, J., Detmers, R., Borsdor , T., Aan de Brugh, J., Aben, I., Butz, A. & Hasekamp, O. (2018), ‘Toward global mapping of methane with tropomi: first results and intersatellite comparison to gosat’, Geophysical Research Letters 45(8), 3682-3689.
- Kaskaoutis, D. G., Kumar, S., Sharma, D., Singh, R. P., Kharol, S. K., Sharma, M., Singh, A. K., Singh, S., Singh, A. & Singh, D. (2014), ‘Effects of crop residue burning on aerosol properties, plume characteristics, and long-range transport over northern India’, Journal of Geophysical Research: Atmospheres 119(9), 5424-5444.
- Langmann, B., Duncan, B., Textor, C., Trentmann, J. & van der Werf, G. R. (2009), ‘Vegetation fire emissions and their impact on air pollution and climate’, Atmospheric environment 43(1), 107-116.
- Lin, C., Li, Y., Yuan, Z., Lau, A. K., Li, C. & Fung, J. C. (2015), ‘Using satellite remote sensing data to estimate the high-resolution distribution of ground-level pm2.5’, Remote Sensing of Environment 156, 117-128.
- Parker, R. J., Boesch, H., Wooster, M. J., Moore, D. P., Webb, A. J., Gaveau, D. & Murdiyarso, D. (2016), ‘Atmospheric ch4 and co2 enhancements and biomass burning emission ratios derived from satellite observations of the 2015 Indonesian fire plumes’, Atmospheric Chemistry and Physics 16(15), 10111-10131.
- Peuch, V. H., Engelen, R., Ades, M., Barre, J., Inness, A., Flemming, J., Kipling, Z., Panareda, A. A., Parrington, M., Ribas, R. & et al. (2018), The use of Satellite Data in the Copernicus Atmosphere Monitoring Service (CAMS), IEEE, pp. 1594-1596.
- Sentinel-5P (2020). URL: https://sentinel.esa.int/web/sentinel/missions/sentinel-5p Accessed 18 Nov. 2020.
- Silva, S. & Arellano, A. (2017), ‘Characterizing regional-scale combustion using satellite retrievals of co, no2 and co2’, Remote sensing 9, 744.
- Yumimoto, K., Uno, I. & Itahashi, S. (2014), ‘Long-term inverse modeling of Chinese co emission from satellite observations.’, Environmental Pollution 195, 308-318.
Emission factors and air quality - laboratory and in-situ measurements
Content in preparation