- Home
- About
- Student Led
- Research Informed
- Practice Focused
- Resources
- News
- Green Campus Podcasts
- Case Studies
- Green Labs Community
News
Energy Performance March 2023
Welcome to our monthly energy blog where we communicate UCC’s energy performance.
Electrical
Electrical consumption reduced for the second month in a row, down 6% when compared to March 2019. UCC consumed 1.6 GW/h of electricity over March -For context - we would need around 75,000 PV panels to generate this much electricity over the month.

Chart 1 : Shows the Spread of Electrical Users across the Estate.
WGB continues to be UCC’s most significant energy user, accounting for just over 21% of our electrical use, while the Kane building, which is the building we review in this post, has overtaken the Library as the second largest consumer of electricity in UCC and is now consuming 13% more electricity than 2018/19. The Boole Library occupancy and utilisation has increased over the last month but the team in the library continue to work on eliminating energy waste. The Pharmacy team continue to closely manage energy use and they have reduced the buildings energy load by 16%, when compared to 2018/19.
For the academic year 22/23 the University is 5% below our electrical baseline, exceeding our 2% reduction target (Chart 2) for the year and all indicators are that if we continue to closely manage our consumption we could be on track for a 6% reduction by the end of the academic year, a welcome result given the increase in electricity costs.
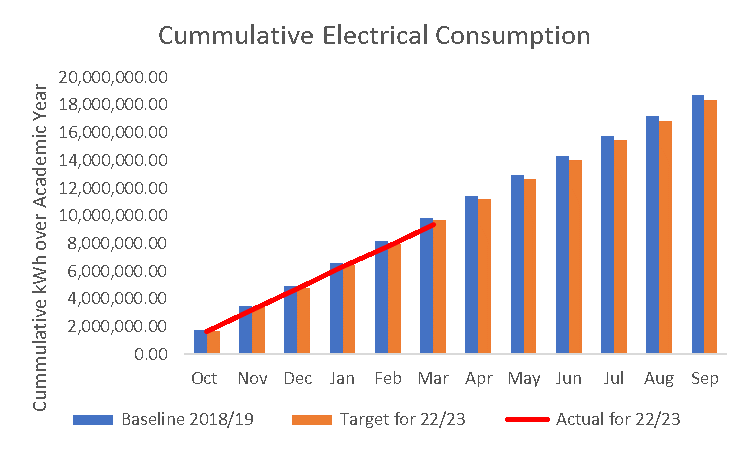
Chart 2 Shows the cumulative electrical use verse our target.
Gas Consumption
Our gas use is heavily dictated by the heating schedules and external conditions. Consumption for March came to 2,512,087 kWh, up 422,000 kWh on February’s consumption. The Main Campus steam network dominates the monthly gas consumption. The network supplies heat to the Kane, Electrical Eng, Civil Eng, Boole, Main Rest, Hub and the Quad.

Chart 3 – Gas users for the month of March
When compared to the Oct 18- March 19 period (Chart 4) gas consumption overall has increased by 946,000 kWh as we try to minimise the impact of extended opening hours and increased ventilation rates.

Chart 4 – Change in Gas use Oct – March 22/23 v 18/19
The focus building for this month’s post is the Kane Building, its energy use and future plans.
Built in the 1970’s the Kane Building houses Labs, Lecture Halls, Film Studios, specialist research labs and equipment. Opened in 1971, the building needs a major refurbishment both in terms of facilities provided and in terms of the building fabric. Some internal improvements have been undertaken in recent years to undergraduate and research laboratories with part funding being secured from the Higher Education Authority under the Devolved Grant for Summer Projects and under the Research Facilities Enhancement Scheme (RFES) – You can find out more about the projects and plans here.
Given the age of the infrastructure the ability to install additional metering has proven difficult over the years but a number of meters have been installed as part of the ongoing refurbishment and upgrade projects.
Research Labs dominate the electrical consumption and audits carried out over the last 5 years indicate that the Labs account for around 65% of the building’s energy load and around 80% of the buildings night load, when the building is closed. The recently commissioned ULV lab has increased the buildings average hourly energy use by 15% while the data centre now accounts for only 7% of the buildings energy load following the free-cooling project completed in 2015.

Chart 5 – Electrical Consumers within the Kane Building.
Chart 6 provides the average hourly weekday electrical profile. The hot water plant is switched on overnight to take advantage of cheaper electrical rates and at a time when the grid is not under pressure. At 07:00 the heating and ventilation systems are switched on and as the building is opened, consumption rises until 10.00 and remains relatively steady until 16:00 when occupancy of the building reduces and equipment is switched off. Depending on the room bookings schedules, heating and ventilation systems are ramped back and by closing time the building electrical consumption levels have returned to baseload levels. The weekend profile remains relatively steady and is influenced by the room booking schedule of the lecture halls over the weekend

Chart 6 – Typical Electrical Profile of Kane Building.
The Main Campus steam network system provides the heating source for the building and the heating typically starts at 07:00 and peaks to 1400 kWh by 08:00 as the heating loops are switched on and system temperatures brought up to 600C. Once the system set points are met the heating load reduces and maintains a steady state until 17:00 when some heating circuits are switched off.
Heating continues, depending on bookings for the lecture halls and is typically switched off by 22.00.
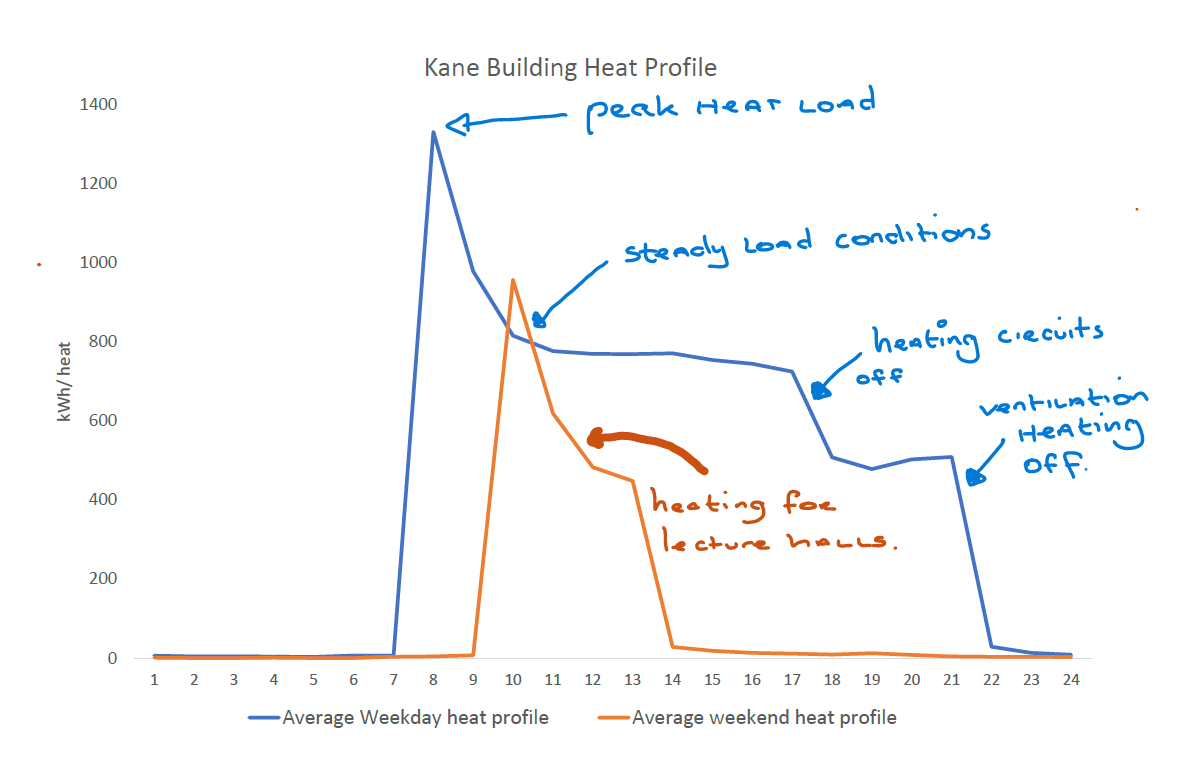
Chart 7 – Heating Profile of the Kane Building.
Weekend use is heavily influenced by the lecture hall booking schedule and the Estates office try to manage the booking schedule to minimise the need for heating at weekends.
Future Plans for the Building
The building is earmarked for a significant upgrade and the Capital Projects office have developed a number of design schemes for deep retrofitting the building to bring it up to current energy standards as well as expanding and refurbishing the internal spaces. Extensive studies on the constructability, the use of low carbon materials and strategies for reducing the electrical and heating demands have been completed so that if and when funding becomes available for the building refurbishment, the project will meet the climate action goals of the University.