

Perinatal Mortality National Clinical Audit in Ireland - Annual Report 2023
Main body of the report
1. Introduction
The report is divided into eight sections of which six focus on perinatal deaths born with a birthweight ≥500g or having achieved a gestational age of ≥24 weeks. Some terminations of pregnancy meet these criteria and are reported to the audit. This allows for the calculation of perinatal mortality rates both including and excluding these cases. However, such cases are excluded from the main findings presented in this report. An additional section describes early neonatal deaths born with a birthweight <500g and a gestational age at birth <24 weeks.
Information on the 2023 birth cohort, definitions and methodology are available here. Guidance on interpreting rate ratios and funnel plots are described here.
(7).png)
2. Perinatal mortality rates
The incidence of stillbirths, neonatal deaths and perinatal mortality, based on births with a birthweight of ≥500g or a gestational age ≥24 weeks in 2023, are presented in this section. Stillbirths and early neonatal deaths accounted for 67.2% (n=158 of 235) and 32.8% (n=77) of perinatal deaths. Perinatal deaths following termination of pregnancy are excluded from mortality rates.
In 2023, the perinatal mortality rate in Ireland was 4.30 per 1,000 total births. The stillbirth rate was 2.89 per 1,000 births, while the early neonatal death rate was 1.41 per 1,000 live births. The adjusted perinatal mortality rate, which excludes deaths associated with major congenital anomalies, was 3.00 per 1,000 total births. The extended perinatal mortality rate, which includes late neonatal deaths, was 4.92 per 1,000 total births, and the extended perinatal mortality rate, adjusted for major congenital anomaly, was 3.48 per 1,000 total births. The Irish extended perinatal mortality rate, without adjustment for major congenital anomaly, is comparable to the MBRRACE-UK 2023 rate of 4.84 per 1,000 births1.
There was a significant decrease in perinatal mortality in 2023 compared to 2022, a 19% decrease in the total perinatal mortality rate (Rate ratio, RR=0.81, 95% confidence interval, CI=0.68-0.96, p-value=0.017) and a similar 20% decrease when considering the perinatal mortality rate adjusted by excluding cases involving major congenital anomaly (RR=0.80, 95% CI=0.65-0.98, p-value=0.033). The decrease was evident and similar in magnitude for the total stillbirth rate (RR=0.82, 95% CI=0.67-1.02, p-value=0.070), the stillbirth rate adjusted for major congenital anomaly (RR=0.85, 95% CI=0.67-1.08, p-value=0.183), and the total rate of early neonatal death (RR=0.79, 95% CI=0.58-1.06, p-value=0.113) and its adjusted rate (RR=0.67, 95% CI=0.45-1.01, p-value=0.055).
Table 1: Frequency and rate of perinatal mortality outcomes, 2023.
| Perinatal deaths categories | Birthweight ≥500g or gestational age ≥24 weeks | Birthweight ≥500g or gestational age ≥24 weeks |
|---|---|---|
| Number | Rate (95% CI) | |
| Total births | 54659 | |
| Stillbirths | 158 | 2.89(2.46-3.38) |
| Adjusted stillbirths | 125 | 2.29(1.90-2.72) |
| Early neonatal deaths | 77 | 1.41(1.12-1.77) |
| Adjusted early neonatal deaths | 39 | 0.72(0.51-0.98) |
| Perinatal deaths | 235 | 4.30(3.77-4.88) |
| Adjusted perinatal deaths | 164 | 3.00(2.56-3.50) |
| Late neonatal deaths* | 34 | 0.62(0.43-0.87) |
| Extended perinatal deaths | 269 | 4.92(4.35-5.54) |
| Adjusted extended perinatal deaths | 190 | 3.48(3.00-4.01) |
Note: The table excludes births and perinatal deaths following termination of pregnancy. The rate of stillbirths, perinatal deaths, late neonatal deaths and extended perinatal deaths is calculated per 1,000 total births, except for the early neonatal death rate, which is calculated per 1,000 live births; 95% CI=95% Poisson confidence interval; The adjusted perinatal mortality rate excludes deaths due to major congenital anomalies; Extended perinatal deaths include late neonatal deaths, early neonatal deaths and stillbirths. *Three late neonatal deaths did not meet the criteria birthweight >500g or gestational age >24 weeks and were excluded from the rate.
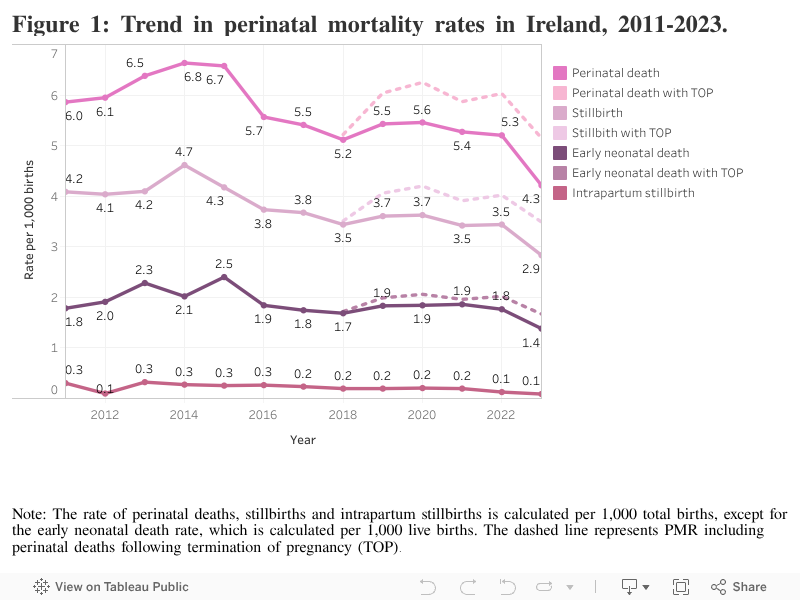
Perinatal mortality gradually declined from 6.8 per 1,000 total births in 2014 to 5.2 per 1,000 in 2018. There was no further decline in perinatal mortality between 2018 and 2022. The decrease in 2023 resulted in the rate reaching the lowest level ever recorded. The stillbirth rate showed a similar pattern, with a decline beginning in 2014, while early neonatal death rates decreased from 2015 onward.
Perinatal mortality rates across Irish maternity units
In Ireland, women with high-risk pregnancies may be transferred to tertiary maternity units with specialist fetal medicine and high-level neonatal intensive care facilities for their maternity care. These in-utero transfers contribute to differences in the kinds of patients cared for in tertiary maternity units compared to smaller hospitals, with the larger units typically managing more complex or high-risk cases. The variation in perinatal mortality rates between units and the impact of in-utero transfer on a unit’s rate is illustrated in the following graphs. Without these in-utero transfer cases, almost all of the smaller maternity units would have had a higher perinatal mortality rate, while the four tertiary maternity units (labelled P, Q, R and S) would have a lower rate. The solid horizontal line represents the national perinatal mortality rate in 2023 (4.30 deaths per 1,000 total births) and the lettered square markers represent each unit’s perinatal mortality rate. One unit, the Coombe (CH - R), initially had an unadjusted perinatal mortality rate above the national rate and above the upper 95% confidence limit. Red markers indicate changes associated with corrections for in-utero transfers. One small unit, Letterkenny (LUH - I), had an unadjusted perinatal mortality rate below the lower 95% confidence limit. Following adjustment for in-utero transfers, the perinatal mortality rate for all units remained between the upper and lower 95% confidence limits with no unit being identified as a statistical outlier.
Figure 2: Funnel plot of the perinatal mortality rate for Irish maternity units, 2023.
.png)
Note: The funnel plot excludes births and perinatal deaths associated with termination of pregnancy. Two units (E=5.26 & H=4.99) have similar perinatal mortality rates represented by the overlapping lettered square markers. The letter identifying units will differ between funnel plots and between reporting years. Red markers indicate changes associated with corrections for in-utero transfers.
| A - Tipperary (TippUH) |
F - Portiuncula (PUH) |
K - Waterford (UHW) |
P - Cork (CUMH) |
| B - Kerry (UHK) |
G - Mayo (MUH) |
L - Mullingar (RHM) |
Q - National Maternity (NMH) |
| C - Sligo (SUH) |
H - Portlaoise (MRHP) |
M - Galway (UHG) |
R - Coombe (CH) |
| D - Cavan (CGH) |
I - Letterkenny (LUH) |
N - Drogheda (OLOL) |
S - Rotunda (RH) |
| E - Kilkenny (SLHK) |
J - Wexford (WGH) |
O - Limerick (UMHL) |
|
The solid horizontal line represents the national adjusted perinatal mortality rate in 2023 (3.00 deaths per 1,000 total births) based on the 164 perinatal deaths not due to major congenital anomaly and without termination of pregnancy. One unit, the Coombe (CH - R), initially had an unadjusted perinatal mortality rate above the national rate and above the upper 95% confidence limit limit but with adjustment for in-utero transfers, the rate was below that limit. The National Maternity Hospital (NMH – Q) had a perinatal mortality rate similar to the national rate and adjusting for in-utero transfers brought the rate below the lower 95% confidence limit. One small unit, Mullingar (RHM - L), had a perinatal mortality rate between the national rate and the upper 95% confidence limit and after adjusting for in-utero transfers, the perinatal mortality rate was above this limit but below the upper 99.8% confidence limit.
Figure 3: Funnel plot of the adjusted perinatal mortality rate for Irish maternity units, 2023.
.png)
Note: The figure excludes perinatal deaths due to major congenital anomalies and termination of pregnancy. Two units (C=1.65 & D=1.58) have similar unit rates, as represented by the overlapping lettered square markers. The letter identifying units will differ between funnel plots and between reporting years. Red markers indicate changes associated with adjusted for in-utero transfers.
| A - Tipperary (TippUH) |
F - Portiuncula (PUH) |
K - Waterford (UHW) |
P - Cork (CUMH) |
| B - Kerry (UHK) |
G - Mayo (MUH) |
L - Mullingar (RHM) |
Q - National Maternity (NMH) |
| C - Sligo (SUH) |
H - Portlaoise (MRHP) |
M - Galway (UHG) |
R - Coombe (CH) |
| D - Cavan (CGH) |
I - Letterkenny (LUH) |
N - Drogheda (OLOL) |
S - Rotunda (RH) |
| E - Kilkenny (SLHK) |
J - Wexford (WGH) |
O - Limerick (UMHL) |
|
3. Maternal and infant characteristics
The findings presented below relate to characteristics of mothers of stillbirths and early neonatal deaths born with a birthweight ≥500g or having achieved a gestational age ≥24 weeks. Perinatal deaths following termination of pregnancy are not included.
Maternal age
The perinatal mortality rate was highest among mothers under 25 years of age in 2023 (6.38 per 1,000 births; rate ratio 1.74, 95% CI 1.13–2.66) compared to the reference group of mothers aged 30–34 years. Unlike previous years, maternal age greater than 40 years was not associated with a significantly increased risk of perinatal mortality in 2023 (rate ratio 1.30, 95% CI 0.82–2.06). The rate among the 25–29, 35–39, and >40 age groups were broadly similar to those of the reference group.
Table 2: Perinatal death by maternal age, 2023.
| Age group | All births N=54,659 |
Stillbirths N=158 |
Early neonatal deaths N=76* |
All perinatal deaths |
Rate per 1,000 (95% CI) |
Rate Ratio (95% CI) |
|---|---|---|---|---|---|---|
| <25years | 4,703 (8.6) | 19 (12.0) | 11 (14.5) | 30 (12.8) | 6.38 (4.31-9.09) | 1.74 (1.13-2.66) |
| 25-29years | 9,032 (16.5) | 27 (17.1) | 12 (15.8) | 39 (16.7) | 4.32 (3.07-5.9) | 1.17 (0.79-1.74) |
| 30-34years | 19,046 (34.8) | 47 (29.7) | 23 (30.3) | 70(29.9) | 3.68 (2.87-4.64) | 1.00 (reference) |
| 35-39years | 16,844 (30.8) | 49 (31.0) | 22 (28.9) | 71(30.3) | 4.22 (3.29-5.31) | 1.15 (0.82-1.6) |
| ≥40years | 5,034 (9.2) | 16 (10.1) | 8 (10.5) | 24(10.3) | 4.77 (3.06-7.09) | 1.30 (0.82-2.06) |
Note: The table excludes births and perinatal deaths following termination of pregnancy. Values are shown as n(%) unless otherwise stated. *Age of the mother unknown for one early neonatal death. Number of births >/=500g or >/=24 weeks gestation by mothers’ age for 2023 were provided by the Healthcare Pricing Office2. 95% CI=Exact Poisson 95% confidence intervals; RR=Rate ratio, comparing the rate for women in each age group category versus the rate for women in the 30-34 years category.
Parity
In 2023, the perinatal mortality rate was highest among women with parity of three or more (5.55 per 1,000 births), but this did not reach statistical significance compared to nulliparous women (rate ratio 1.10, 95% CI 0.71–1.71). Unlike 2022, higher parity was not associated with an increased risk of perinatal mortality this year. At 3.02 per 1,000 births, women with one previous birth had the lowest risk, 40% lower than the risk for nulliparous women.
Table 3: Perinatal death by parity, 2023.
| Parity | All births N=54,659 |
Stillbirths |
Early neonatal deaths |
All perinatal deaths N=234* |
Rate per 1,000 (95% CI) |
Rate Ratio (95% CI) |
|---|---|---|---|---|---|---|
| Para 0 | 23,085 (42.2) | 78 (49.7) | 38 (49.4) | 116 (49.6) | 5.02 (4.15-6.02) | 1.00 (reference) |
| Para 1 | 18,553 (33.9) | 35 (22.3) | 21(27.3) | 56 (23.9) | 3.02 (2.28-3.92) | 0.60 (0.44-0.83) |
| Para 2 | 8,695 (15.9) | 26 (16.6) | 12 (15.6) | 38 (16.2) | 4.37 (3.09-5.99) | 0.87 (0.6-1.25) |
| Para 3+ | 4,326 (7.9) | 18 (11.5) | 6 (7.8) | 24 (10.3) | 5.55 (3.56-8.24) | 1.1 (0.71-1.71) |
Note: The table excludes births and perinatal deaths following termination of pregnancy. Values are shown as n(%) unless otherwise stated; *Parity unknown for one stillbirth. Para 0 equals nulliparous women. Number of births >/=500g OR >/=24 weeks gestation by parity for 2023 were provided by the Healthcare Pricing Office2. 95% CI=Exact Poisson 95% confidence intervals; RR=Rate ratio, comparing the rate for women in each parity category versus the rate for women in the nulliparous category.
Multiple births
An increased risk of perinatal mortality associated with multiple births compared to singleton pregnancies was again identified in 2023 (rate ratio 3.47, 95% CI 2.31–5.22). Perinatal deaths from multiple births accounted for 11% of all perinatal deaths but only 3.5% of all births.
Table 4: Perinatal death from singleton and multiple births, 2023.
| All births N=54, 659 |
Stillbirths N=158 |
Early neonatal deaths N=77 |
All perinatal deaths |
Rate per 1,000 (95% CI) |
Rate Ratio (95% CI) |
||
|---|---|---|---|---|---|---|---|
| Singleton | 52,767 (96.5) | 146 (92.4) | 63 (81.8) | 209 (88.9) | Singleton | 3.96 (3.44-4.53) | 1.00 (reference) |
| Twin | 1,892 (3.5) | 11 (7) | 14 (18.2) | 25 (10.6) | Multiple | 13.74 (9-20.07) | 3.47 (2.31-5.22) |
| Triplet | - | 1 (0.6) | 0 (0) | 1 (0.4) | - | - |
Note: The table excludes births and perinatal deaths following termination of pregnancy. Values are n(%) unless otherwise stated. Number of births >/=500g or >/=24 weeks gestation in singleton and multiple pregnancies for 2023 were provided by the Healthcare Pricing Office2. 95% CI=Exact Poisson 95% confidence intervals; RR=Rate ratio, comparing the rate for multiple births versus the rate for singleton births.
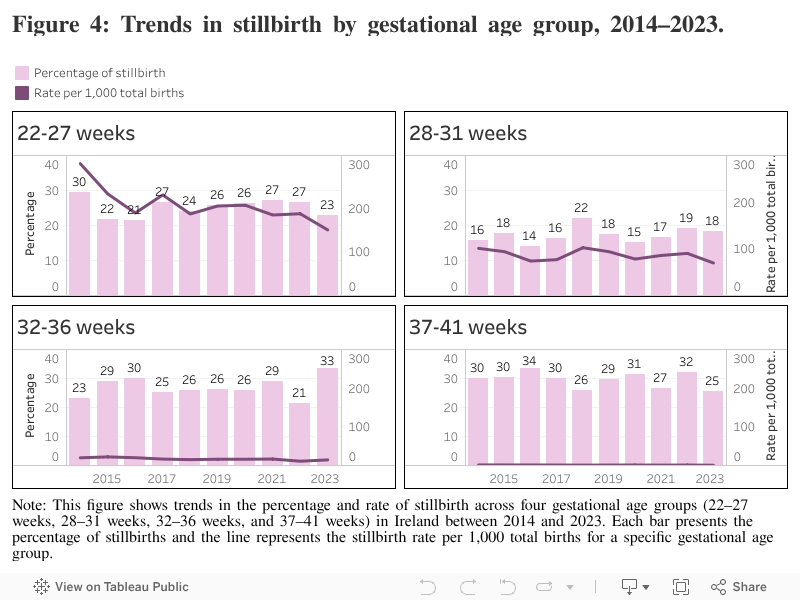
Gestational age at birth
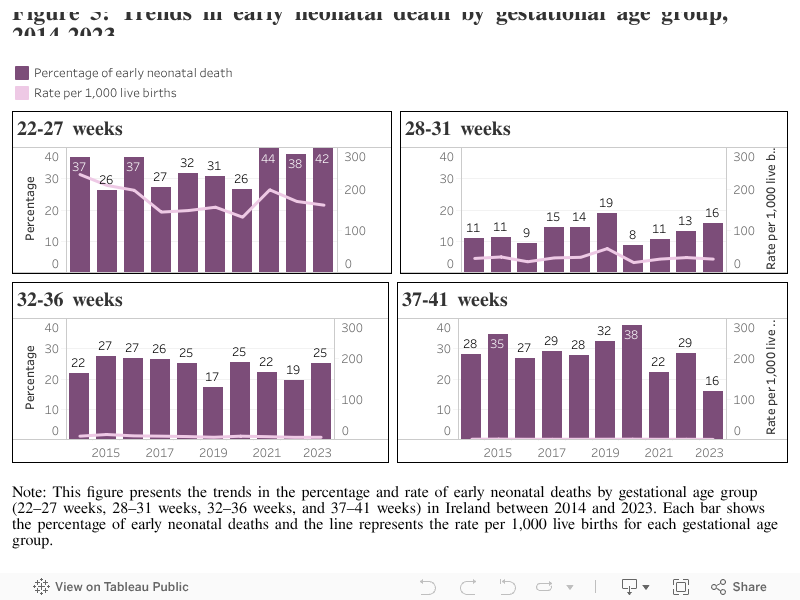
The following figures present trends in stillbirth and early neonatal death by gestational age group in Ireland from 2014 to 2023. The bars represent the percentage of stillbirths and early neonatal deaths occurring within each gestational age range (in weeks), and the lines show the rate per 1,000 births for each group. The stillbirth rate was highest among births at 22–27 weeks, reaching over 250 per 1,000 total births in some years, though percentages varied between 20–30% of all stillbirths. In contrast, stillbirths at 37–41 weeks consistently accounted for around 25–34% of cases but occurred at much lower rates, typically under 5 per 1,000 births. Rates and percentages remained relatively stable over time, especially for later gestational age groups.
Early neonatal deaths are predominantly concentrated in births between 22–27 weeks gestation, with rates over 150 per 1,000 live births in most years. Deaths at 37–41 weeks are rare, consistently accounting for around 1% or less of all births across the period.
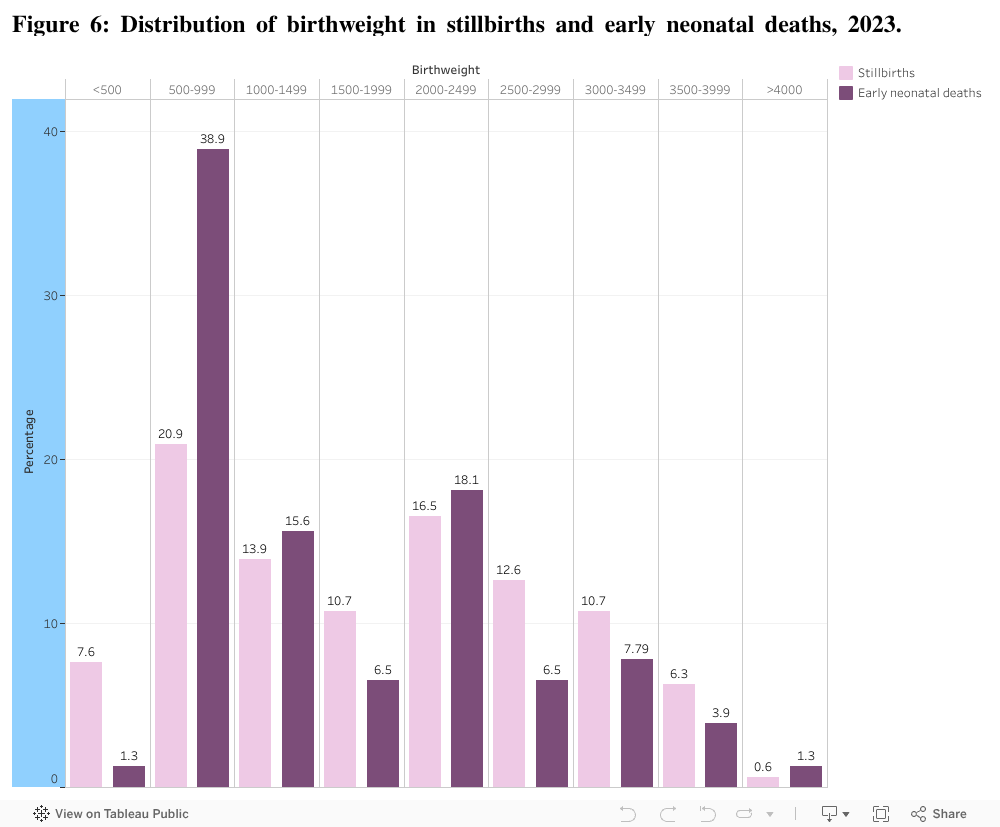
Birthweight
In 2023, the highest proportion of stillbirths and early neonatal deaths occurred among infants born weighing 500–999g, with a higher percentage of early neonatal deaths in that birthweight group. The proportion sharply declined with increasing birthweight, with both outcomes rare among infants over 3,500g.
Birthweight centiles
An increased risk of perinatal death has been associated with suboptimal fetal growth in-utero. The optimal weight and normal range for all gestations are plotted with the actual birthweight of perinatal deaths. As in previous years, the prevalence of small for gestational age and severe small for gestational age was higher among stillbirths than in early neonatal deaths. For stillbirths across all gestations, most clustered below the optimal birthweight curve, with a notable proportion below the 10th centile (n=67 of 152, 44.1%), suggesting a strong association with fetal growth restriction. Early neonatal deaths were more evenly distributed around the optimal weight curve, with fewer cases falling below the 10th centile compared to stillbirths (n=27 of 76, 35.5%).
Figure 7: Optimal birthweight and normal range compared to actual birthweights of stillbirths, 2023.
.png)
Note: this figure shows the distribution of stillbirths by birthweight and gestational age, plotted against reference curves for optimal weight (50th centile), and the 10th and 90th birthweight centiles. Birthweight centile was not calculated for six stillbirths due to missing data required for the calculation (e.g. birthweight, gestational age, maternal height or weight).
Figure 8: Optimal birthweight and normal range compared to actual birthweights in early neonatal deaths, 2023.
.png)
Note: this figure shows the distribution of early neonatal deaths by birthweight and gestational age, plotted against reference curves for optimal weight (50th centile), and the 10th and 90th birthweight centiles. Birthweight centile was not calculated one early neonatal death due to missing data required for the calculation (e.g. birthweight, gestational age, maternal height or weight).
The table below shows the distribution of perinatal deaths by customised birthweight centiles in 2023, compared to the expected distribution in the general birth population. Ten times more perinatal deaths were under the 3rd centile than expected according to customised birthweight centiles, they were approximately four times more likely to be under the 10th centile. Approximately 20% of perinatal deaths were in the 50-89th centile range, whereas 40% of births are expected in this range.
Table 5: Distribution of customised birthweight centiles, 2023.
| Centile | Expected percentage | All perinatal deaths N=228 |
Stillbirths* N=152 |
Early neonatal deaths* N=76 |
|---|---|---|---|---|
| < 3rd | 3% | 65(28.5) | 43(28.3) | 22(28.9) |
| < 10th ** | ~10% | 94(41.2) | 67(44.1) | 27(35.5) |
| 10-49th | ~40% | 63(27.6) | 38(25) | 25(32.9) |
| 50-89th | ~40% | 47(20.6) | 31(20.4) | 16(21.1) |
| 90th+ | 10% | 24(10.5) | 16(10.5) | 8(10.5) |
Note: Values are shown as n(%) unless otherwise stated. * Birthweight centile was not calculated for six stillbirths and one early neonatal death due to missing data required for the calculation (e.g. birthweight, gestational age, maternal height or weight). *The <10th centile includes the previous category of < 3rd centile.
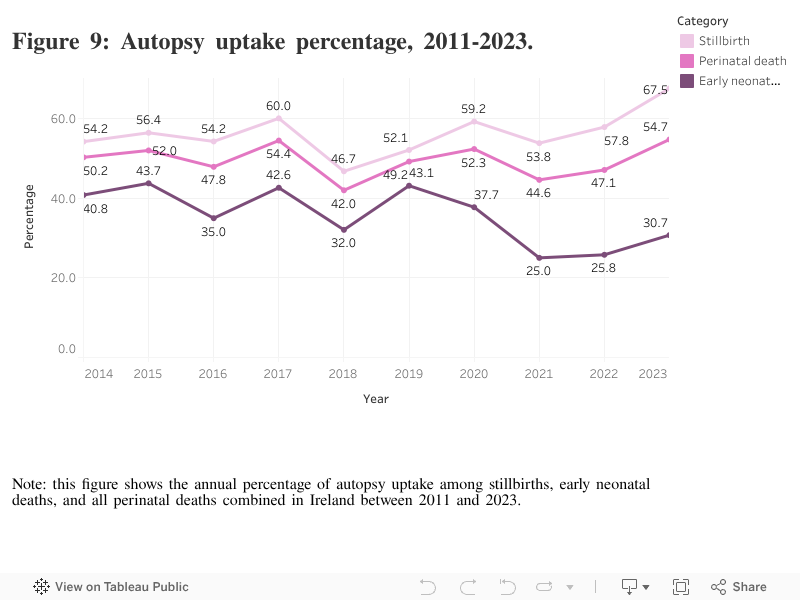
4. Autopsy and placental histology
Autopsy uptake
An autopsy was performed after 54.7% of all perinatal deaths (n=127 of 235) in 2023. The rate of autopsy uptake continues to be higher in stillbirths (n=104 of 158, 65.8%) compared to early neonatal deaths (n=23 of 77, 29.9%). These figures are higher than those in the United Kingdom in 2023 where it was indicated that 44.8% of stillbirths and 25.0% of neonatal deaths had an autopsy.1 In Ireland, parental decline of autopsy was more frequent in early neonatal deaths (n=48 of 77, 62.3%) than in stillbirths (n=47 of 158, 29.7%).
Placental histology uptakes
In 2023, placental histology examinations were conducted for almost all stillbirths (n=157 of 158, 99.4%) and for over 98.0% of early neonatal deaths (n=76 of 77, 98.7%). These figures are slightly higher than the figures reported in Ireland in 2022 (96.2%) and for stillbirths in the United Kingdom in 2023 (92.0%).1
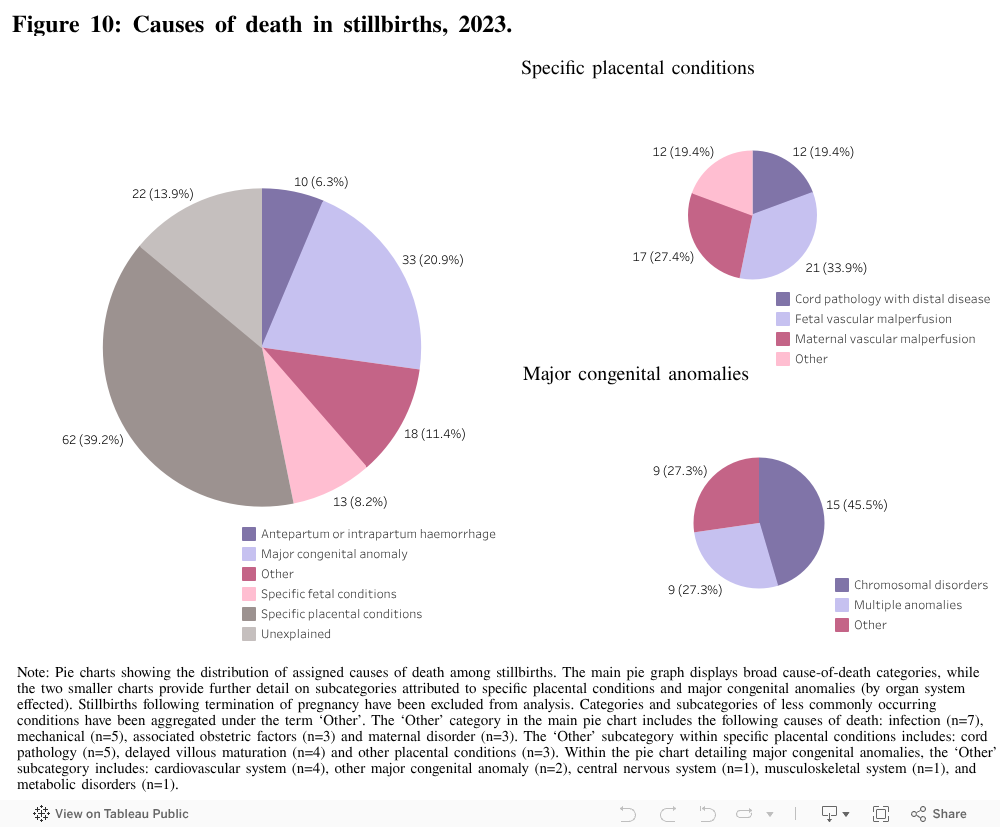
5. Causes of perinatal death
Stillbirths
The cause of death in stillbirths was classified using the National Perinatal Epidemiology Centre’s (NPEC) maternal and fetal classification system. Abnormal placental findings have been classified using broad categories as recommended at an international consensus meeting of pathology, (referred to as the ‘Amsterdam Convention’).
Specific placental conditions was the most common cause of death in stillbirths in 2023 (39.2%). The most commonly occurring placental conditions were fetal and maternal vascular malperfusion, accounting for over 60% of stillbirths due to placental disease. Major congenital anomaly was the second most common cause of death in stillbirths, associated with just over one in five stillbirths (20.9%). A chromosomal disorder was identified in almost half (45.5%) of stillbirths due to major congenital anomaly and almost one third (27.3%) were classified as having multiple anomalies. In 14% of stillbirths, the cause of death was unexplained. However, it must be noted that for 50% of the stillbirths with an unexplained cause of death, it was reported that the maternity unit was still awaiting coronial post-mortem results at time of analysis (n=11 of 22, 50%).
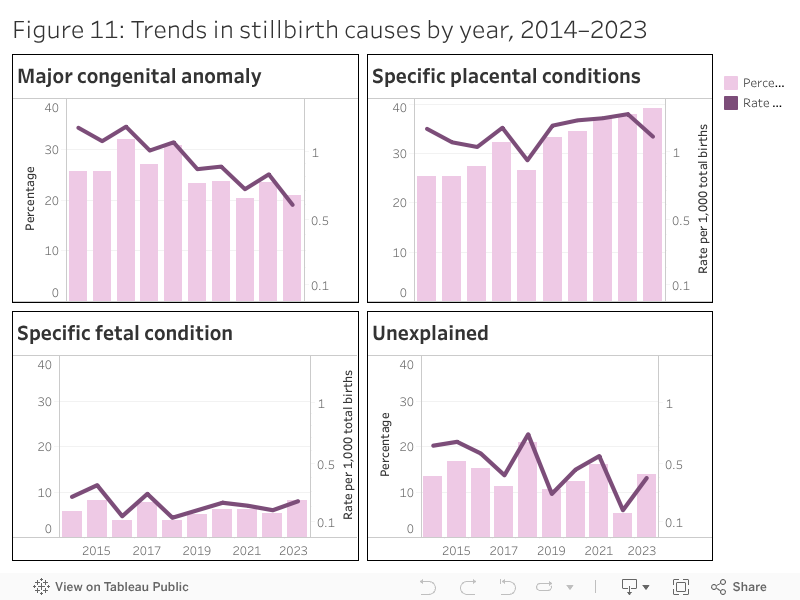
Placental conditions have remained the most prominent cause of stillbirths in recent years. The percentage rose from around 25% in 2014 to nearly 40% in 2023, while the rate per 1,000 total births fluctuated over the years, between 1.20 in 2014 to a high of 1.34 in 2022, slightly decreasing to 1.16 in 2023. Major congenital anomalies have continued their gradual decline in contribution to stillbirths in recent years, both in percentage and rate, reaching 0.60 per 1,000 total births in 2023. This trend may reflect changes in the Irish legislation since 2019, when termination of pregnancy in cases of fatal fetal abnormality was legalised. Unexplained stillbirths have also shown a notable decrease over the decade, falling from nearly 0.64 per 1,000 in 2014 to 0.40 per 1,000 births in 2023. Fetal conditions, (including twin to twin transfusion, fetal maternal haemorrhage and non-immune hydrops), have remained a consistent contributor, with moderate fluctuations across the years. While the highest rate was observed in 2015 (0.35 per 1,000), overall, this category has maintained a stable presence, accounting for around 3–10% of stillbirths.
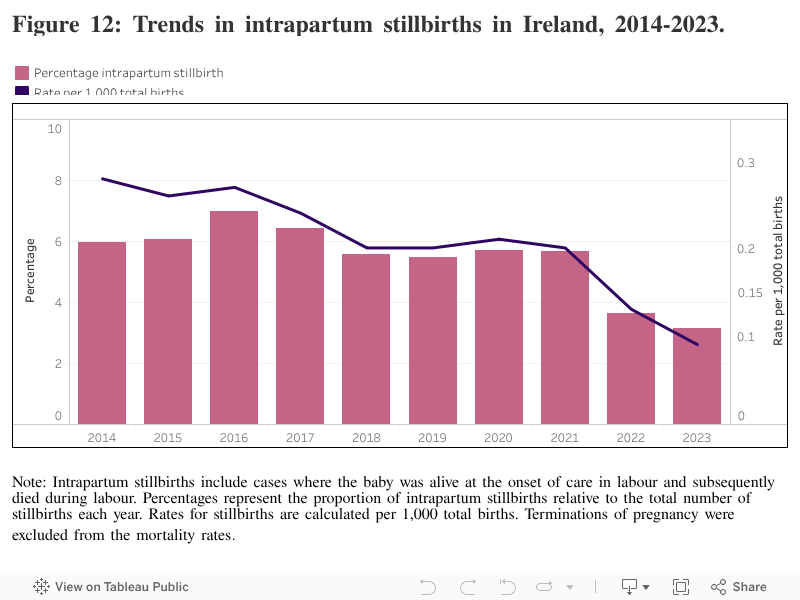
Intrapartum stillbirths
Intrapartum stillbirths include cases where the baby was alive at the onset of care in labour and subsequently died during labour. There were five cases of stillbirth where the baby was known to be alive at the onset of care in labour, accounting for 3.2% of stillbirths and equivalent to 0.09 per 1,000 total births in 2023. The rate of intrapartum death in 2023 in the United Kingdom was 0.25 per 1,000 total births.1 The causes of intrapartum stillbirths included spontaneous premature labour (n=2), multiple congenital anomalies (n=1), chorioamnionitis (n=1), and cord pathology with distal disease (n=1).
Table 6: Life status of baby at the onset of care in labour for stillbirths, 2023.
| Type of stillbirth | Description | N=158 n(%) |
|---|---|---|
| Antepartum | Baby not alive at onset of care in labour | 131(82.9) |
| Never in labour | 15(9.5) | |
| Intrapartum | Baby alive at onset of care in labour | 5(3.2) |
| Not known | 3(1.9) | |
| Unattended | 4(2.5) |
Note: Values are shown as n(%) unless otherwise stated. All the stillbirths who were unattended (n=4) were born before arrival at maternity units and were not booked to a maternity unit for care.
Intrapartum stillbirths show a clear downward trend in both percentage and rate, with the rate per 1,000 total births falling from 0.28 in 2014 to 0.09 in 2023. Thus, the rate of intrapartum stillbirth decreased by approximately 70% over a ten-year period. This suggests sustained improvements in intrapartum care.
Early neonatal deaths
In the case of early neonatal deaths, the cause of death was classified using both the NPEC neonatal classification system and the NPEC maternal and fetal classification system.
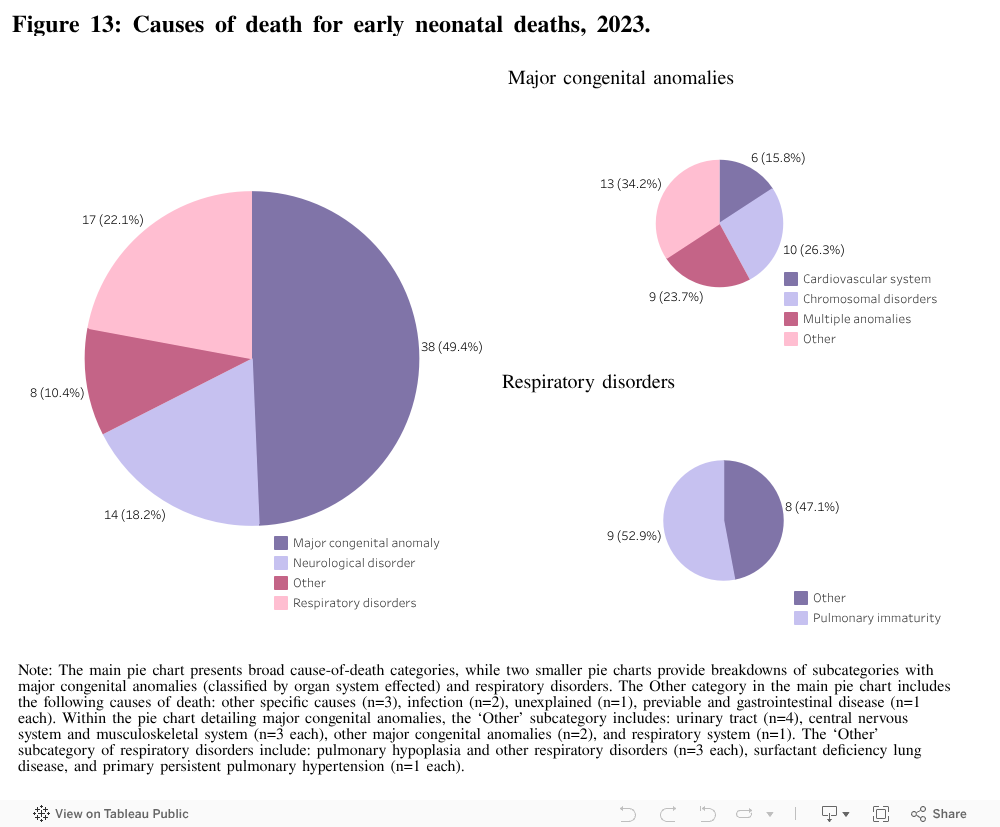
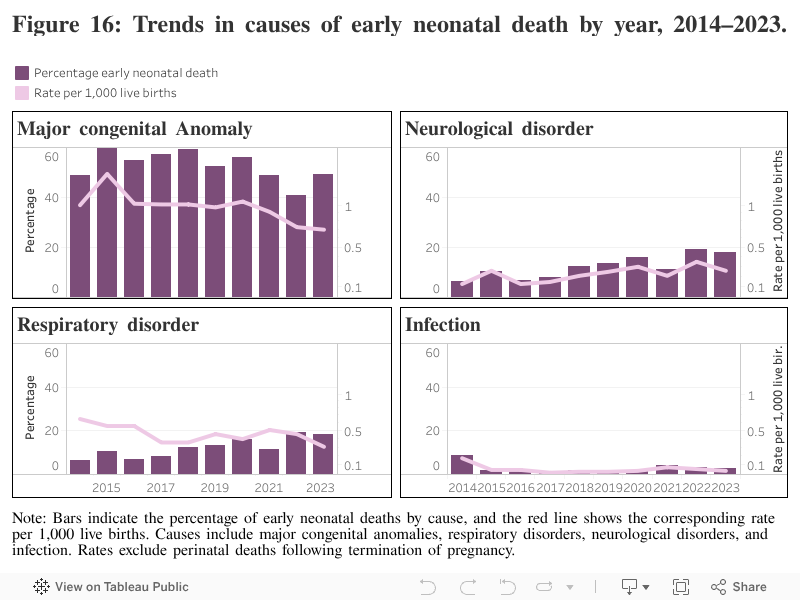
Major congenital anomaly was the most common (49.4%) cause of neonatal death followed by respiratory disorders (22.1%) and neurological disorders (18.2%). Chromosomal disorders (26.3%) and multiple anomalies (23.7%) were the leading major congenital anomalies reported, followed by anomalies of the cardiovascular system (15.8%). Severe pulmonary immaturity was the most commonly reported respiratory disorder accounting for over half (52.9%) of the cases.
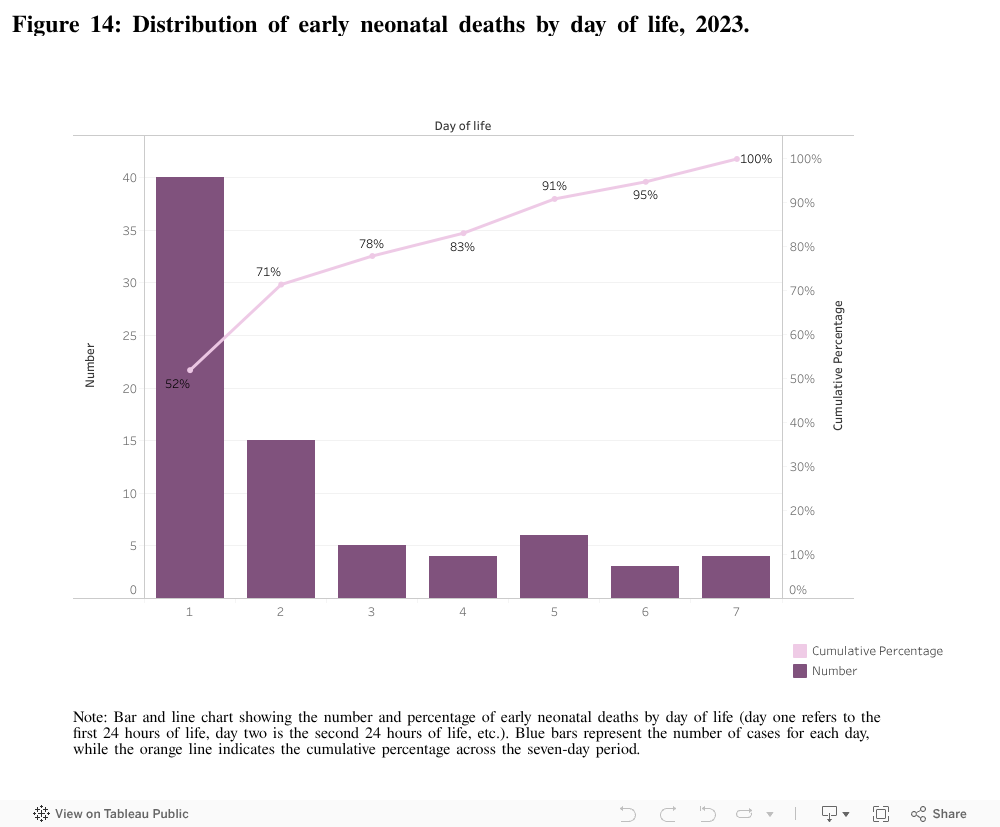
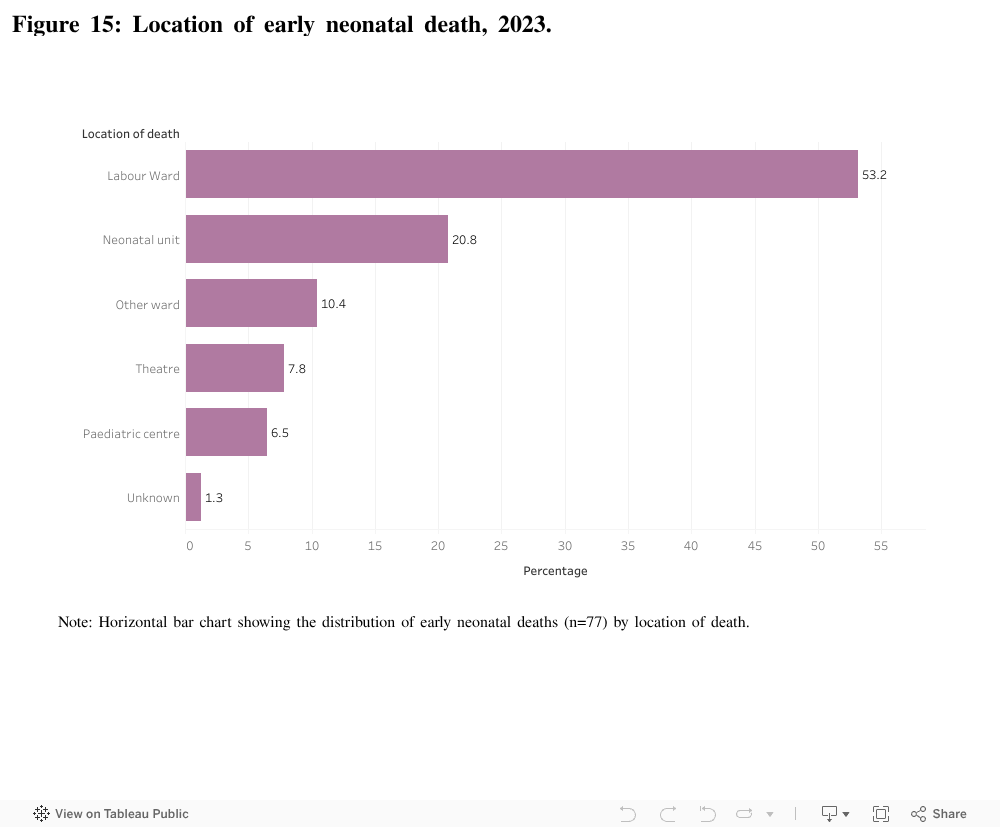
Over half (51.9%) of early neonatal deaths occurred within 24 hours of birth, i.e. within the first completed day (n=40 of 77). Within this cohort, major congenital anomaly (n=23 of 40, 57.5%) and respiratory disorders (n=12 of 40, 30.0%), mainly severe pulmonary immaturity (n=8 of 12, 66.7%), were the main cause of death. Over half of early neonatal deaths in 2023 occurred on the labour ward (53.2%), while one in five occurred in the neonatal unit (20.8%), and 10.4% occurred on the ward in the maternity unit.
The distribution and trends in cause of early neonatal deaths over time show both stability and subtle shifts. Major congenital anomalies remain the leading cause of early neonatal deaths, accounting for around 50–60% of cases across all years. The rate per 1,000 live births has continued its gradual decline since peaking in 2015 at 1.49, reaching 0.70 in 2023. Respiratory disorders consistently rank as the second most common cause, with relatively stable percentages (~20–30%) and a modest decrease in rate, from 0.65 in 2014 to 0.31 in 2023. Neurological disorders show a gradual increase, rising from 0.13 per 1,000 live births in 2014 to 0.35 in 2022, and maintaining a similar level in 2023 (0.26). Infections remain an infrequent but persistent cause of early neonatal death, always below 0.2 per 1,000 live births, without a clear upward or downward trend.
6. Perinatal deaths associated with intrapartum events
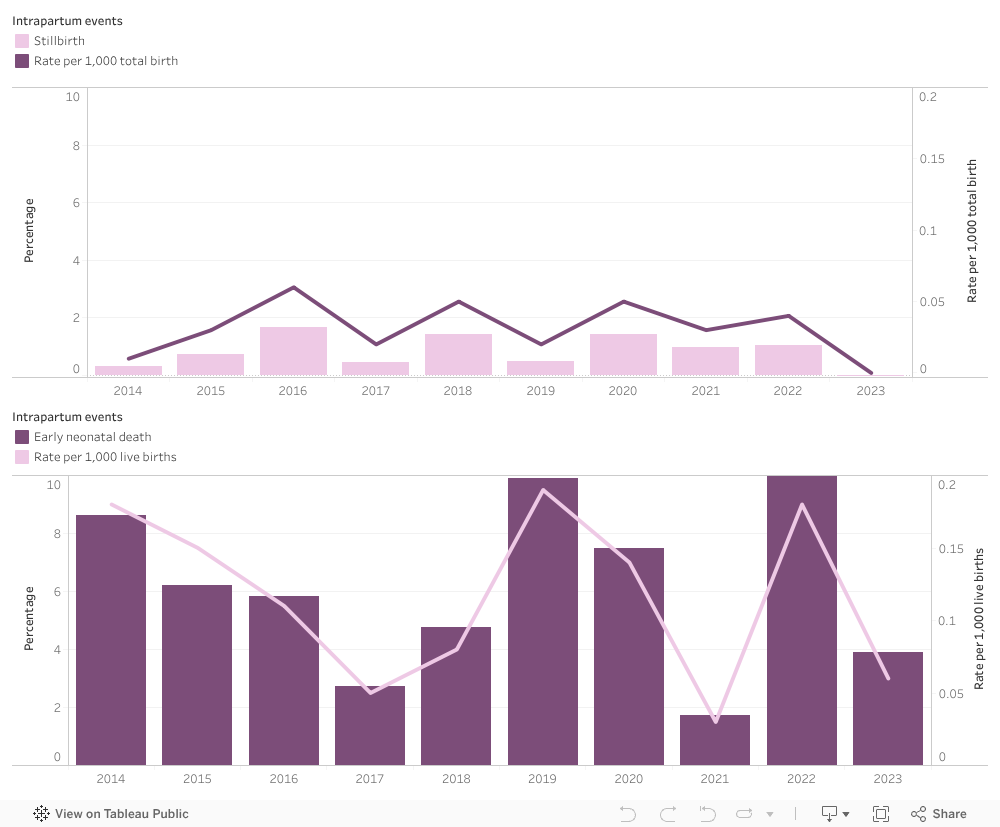
The investigation of perinatal deaths due to intrapartum events is valuable in assessing quality of care. These deaths are unexpected and include stillbirths alive at the onset of professional care in labour and early neonatal deaths with a gestational age of at least 34 weeks and a birthweight of at least 2,500g whose death was not due to major congenital anomaly or infection. Babies who were delivered by pre-labour caesarean section were not included in this cohort.
There were three such cases meeting the criteria in 2023, all early neonatal deaths at term. All cases were subject to coronial review in keeping with legislated mandate reporting requirements. The neonatal cause of death was hypoxic ischaemic encephalopathy with a significant antecedent obstetric factor identified in all cases including placental abruption (n=1), cord prolapse (n=1) and meconium aspiration (n=1).
Early neonatal deaths associated with intrapartum events, meeting this criteria, show more year-to-year variation. Rates per 1,000 live births ranged from a low of 0.03 in 2021 to a peak of 0.19 in 2019, with percentages among total early neonatal deaths also varying modestly. These fluctuations may reflect the sporadic nature of catastrophic antecedent events impacting negatively on the condition of the liveborn baby at birth. Stillbirths associated with intrapartum events represent a smaller and more specific subgroup, with rates remaining consistently low throughout the period. There were no cases that met the criteria in 2023. Percentages within total stillbirths fluctuate slightly but show no clear upward or downward trend.
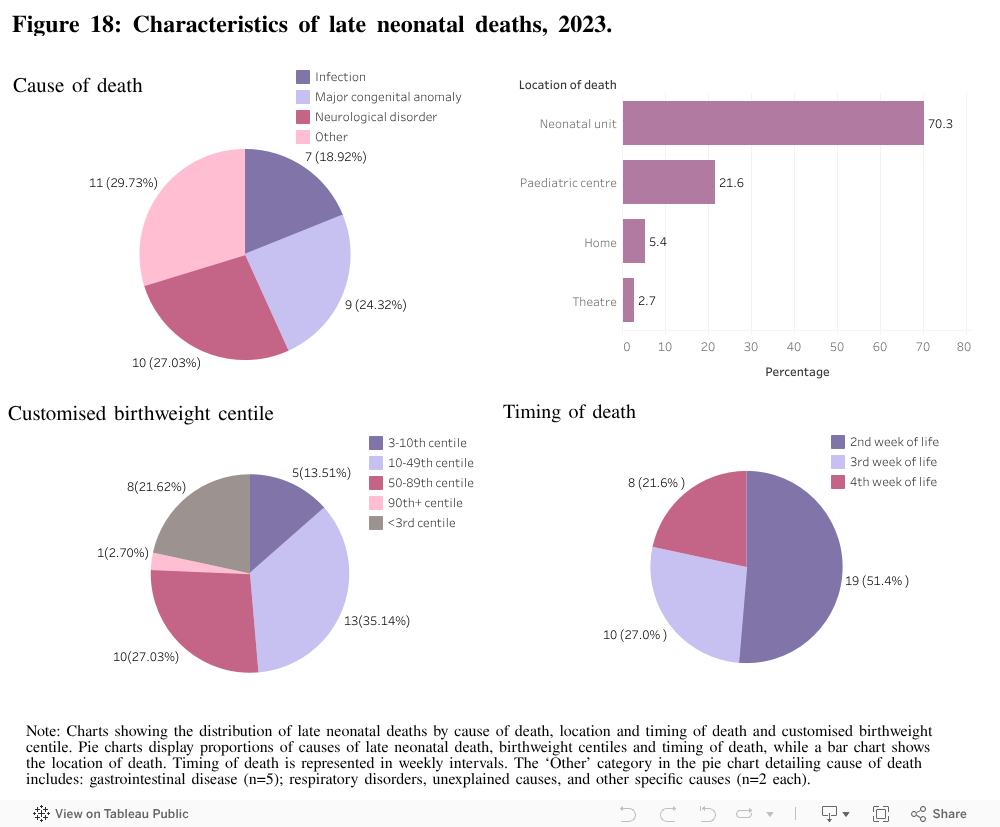
7. Late neonatal deaths
There were 37 late neonatal deaths reported in 2023, of which 34 met the NPEC criteria of having a birthweight of ≥500g or a gestational age of 24 weeks or more at birth. Of the 37 deaths, neurological disorders (27%) and major congenital anomalies (24%) were the leading cause of death, followed by infections (19%). In line with previous reports, the proportion of late neonatal deaths decreased across the second and third weeks of life in 2023 (i.e. of the 37 deaths occurring after the first week of life, 51% occurred in week two, 27% in week three and 22% in week 4). Approximately 70% of infants had a birthweight centile below the 50th, with 22% below the 3rd centile.
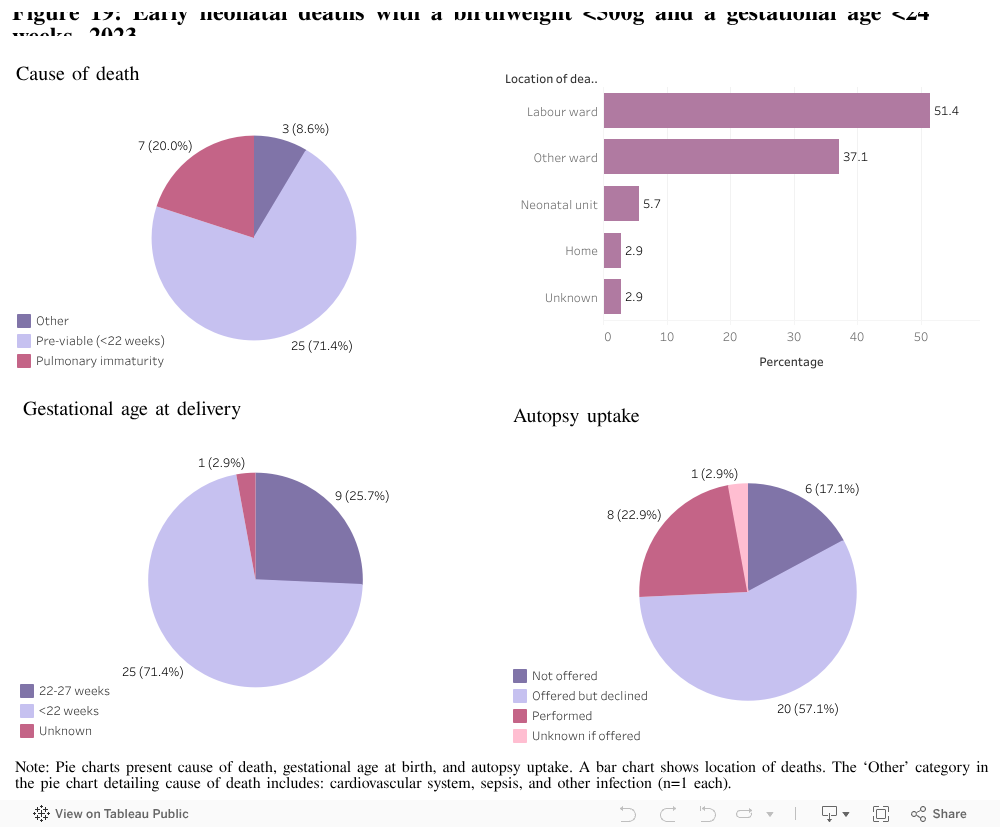
8. Early neonatal deaths with a birthweight <500g and a gestational age of <24 weeks at birth
There were 35 early neonatal deaths with a birthweight <500g and a gestational age at birth <24 weeks, excluding deaths following termination of pregnancy in 2023. The majority of the 35 deaths occurred in babies born less than 22 weeks (71%) with 9 deaths occurring after 22 weeks. The assigned neonatal cause of death was pre-viable for the majority of cases (71%) followed by severe pulmonary immaturity (20%). The majority of deaths took place in the labour ward (51%), with only a small proportion in the neonatal unit (6%). Regarding autopsy uptake, just 23% in this cohort had an autopsy performed. However, in over 57% of cases with no autopsy, an autopsy was offered but presumably declined.
References
- Gallimore ID, Matthews RJ, Page GL, Smith LK, Fenton AC, Knight M, Smith PW, Redpath S, Manktelow BN, on behalf of the MBRRACE-UK Collaboration. MBRRACE-UK Perinatal Mortality Surveillance, UK Perinatal Deaths of Babies Born in 2023: State of the Nation Report. Leicester: TIMMS, Department of Population Health Sciences, University of Leicester. 2025.
- Healthcare Pricing Office. Perinatal Statistics Report 2023. Dublin: Health Service Executive. [in press]
How to cite this report:
San Lazaro Campillo I & Manning E, Corcoran P, Keane J, Greene RA, on behalf of the Perinatal Mortality National Clinical Audit Governance Committee. Perinatal Mortality National Clinical Audit in Ireland Annual Report 2023. Cork: National Perinatal Epidemiology Centre, 2025.