Research Findings
Death and killing in the Irish Civil War
Andy Bielenberg and John Dorney
This project, conducted by UCC and funded under the Government of Ireland’s Decade of Centenaries Programme 2023, is the first systematic attempt to investigate the number of people killed in the Irish Civil War, 28 June 1922–24 May 1923. An additional objective was to record and map the results, to assess the geography and chronology of Civil War fatalities, in addition to examining the social profile of victims. Sources used include the Military Service Pensions Collection (MSPC) and other army service records held at Irish Military Archives as well as James Langton's pioneering estimate of National Army fatalities published in 2019. Commemorative republican material, including the Last Post, was also consulted, and a series of important county studies were invaluable in compiling the database. A full examination of all death certificates for 1922-23 was undertaken, in addition to assorted compensation files and newspapers.
Project Parameters
The project defines the Irish Civil War as an intra-nationalist conflict, focused largely on the twenty-six counties that became the Irish Free State. However, we also examined and mapped conflict deaths in Northern Ireland in the same timeframe, though fatalities there followed a very different pattern. It was necessary to impose temporal boundaries on this project. It begins on the date traditionally accepted as marking the beginning of the military conflict, the opening of the bombardment on the Four Courts on 28 June 1922, and concludes on the date of the Dump Arms Order on 24 May 1923. We identified 1,426 violent deaths in the Free State within this timeframe, of whom 648 were pro-Treaty, 438 were anti-Treaty, 336 were civilians and four were members of the Crown forces. The death toll rises only slightly to 1,485, when fatalities north of the new border are added.
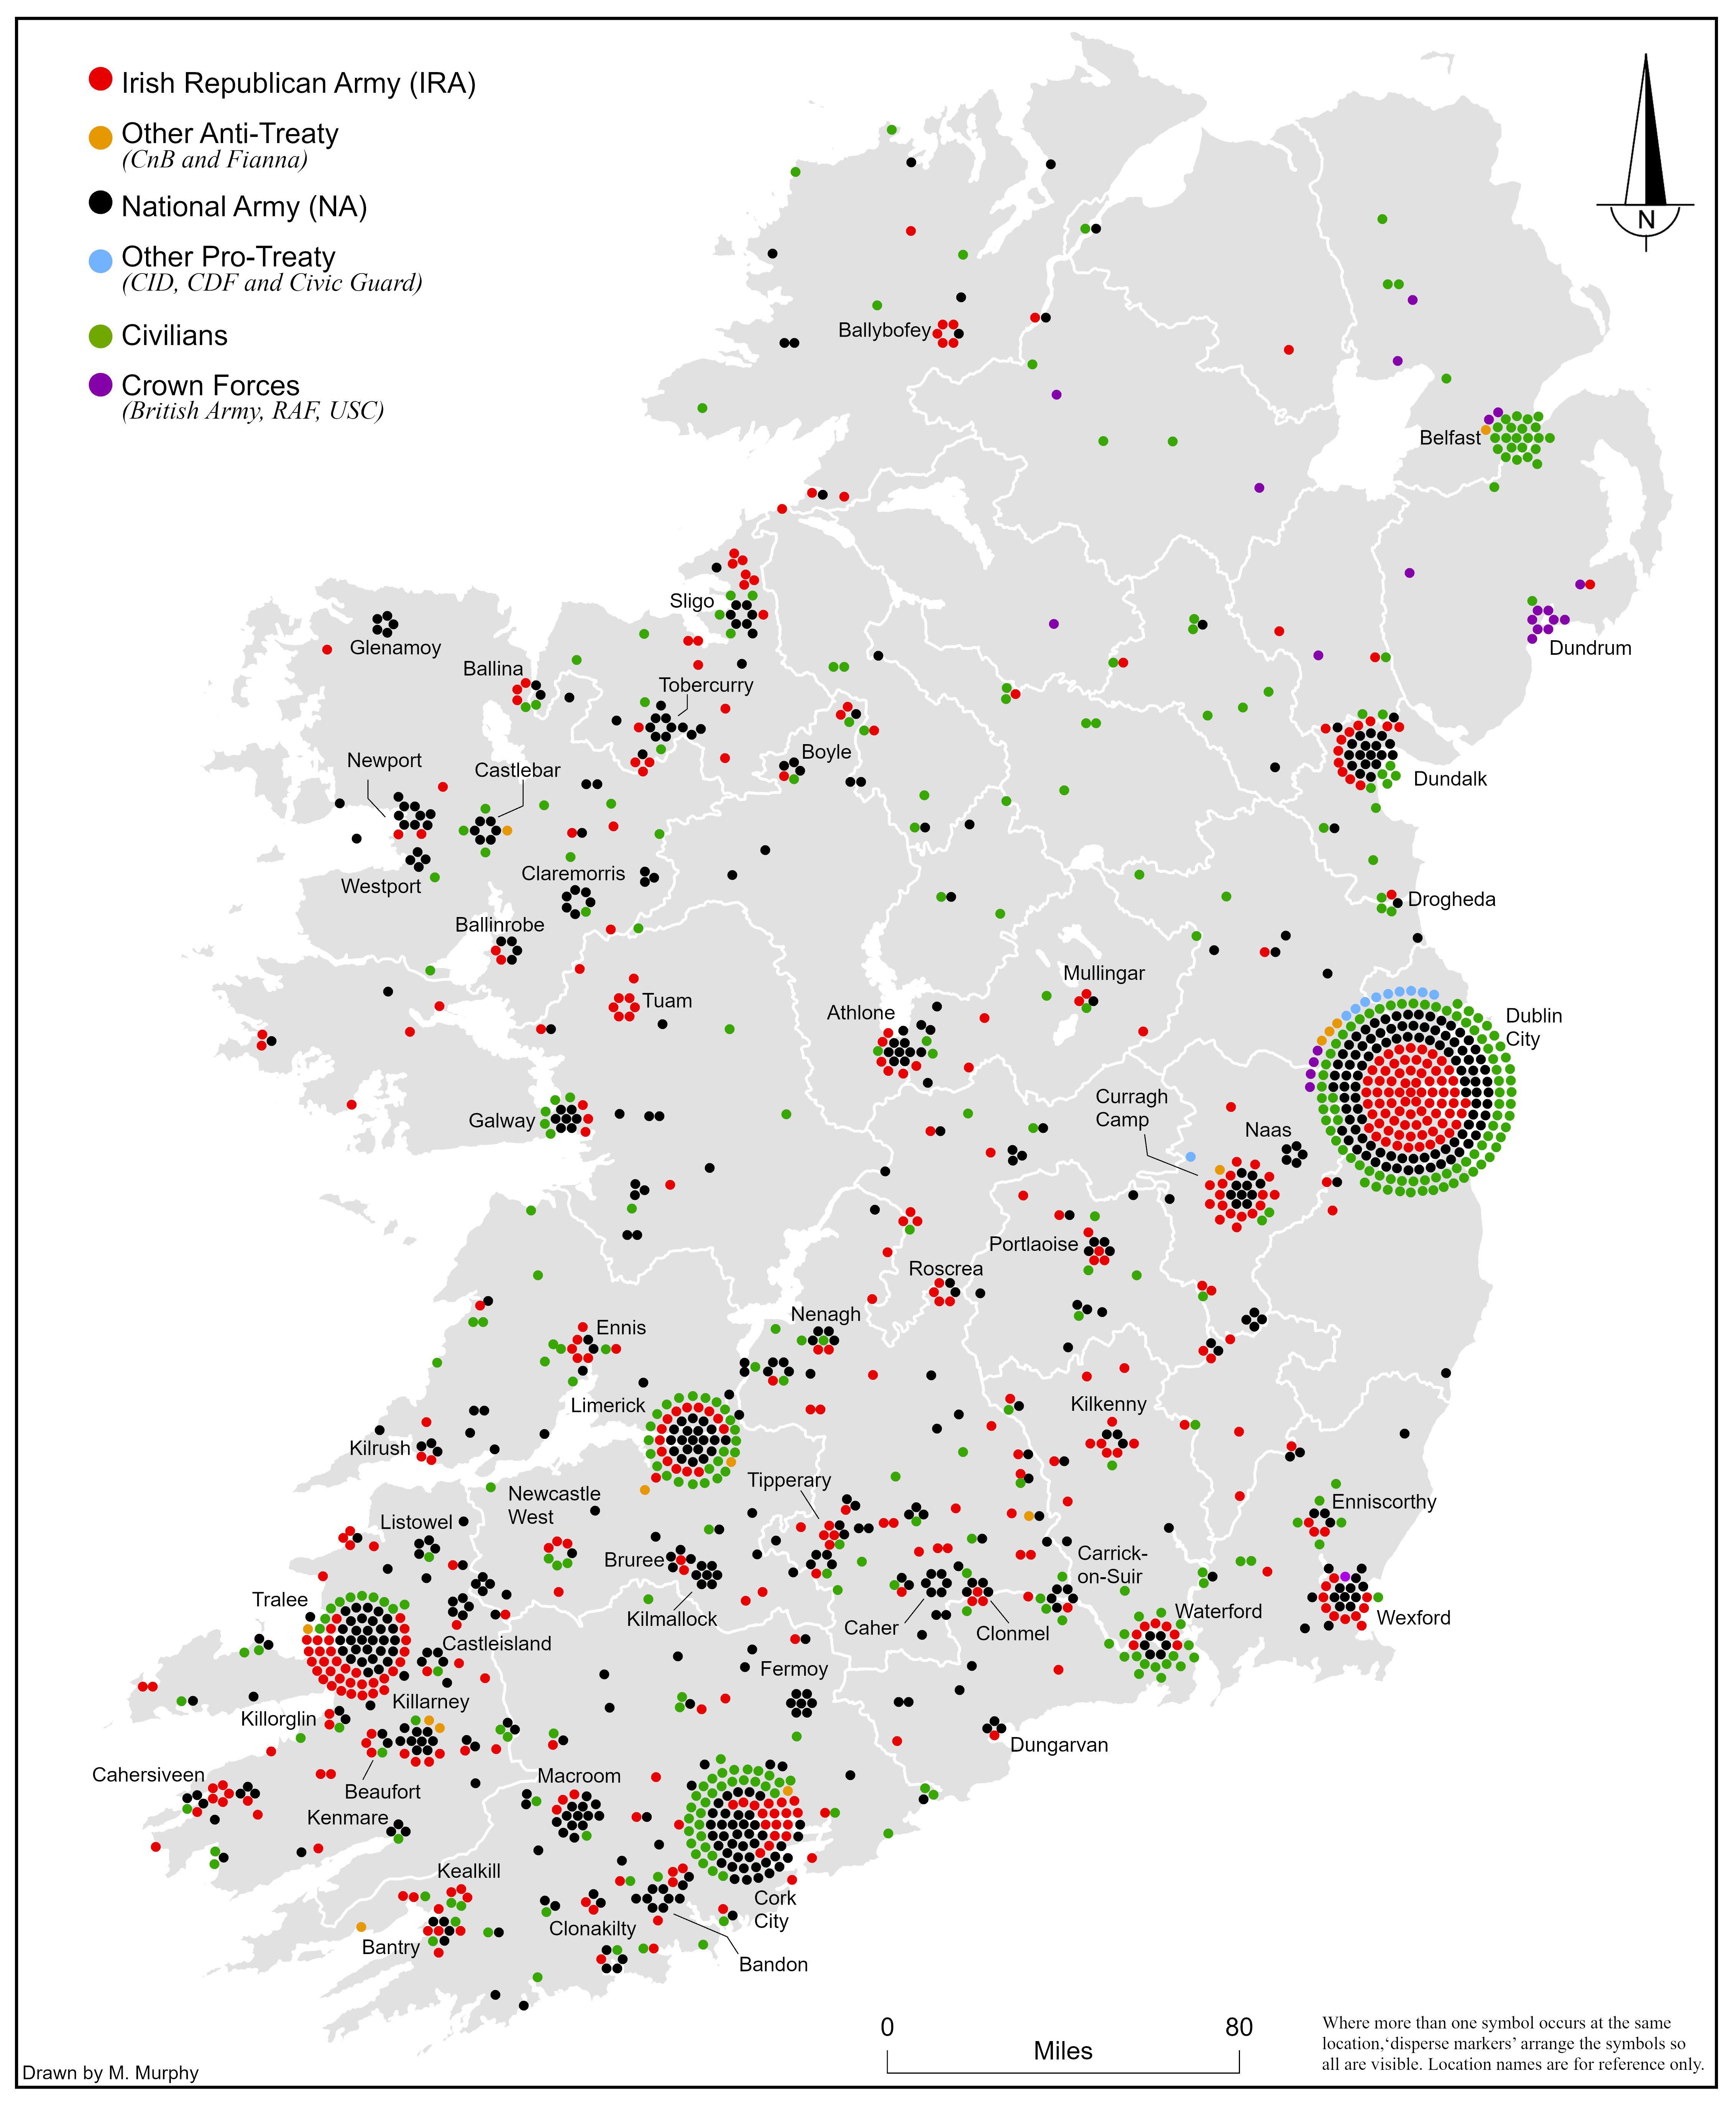
Fig. 1 Map of total fatalities across the thirty-two counties between 28 June 1922 and 24 May 1923. The categories included in this map are, on the anti-Treaty side, IRA, Cumann na mBan and Fianna Éireann, and on the pro-Treaty side, National Army, Civic Guard, Citizens’ Defence Force (CDF) and Criminal Investigation Department (CID). Among crown forces fatalities were members of the British Army, the Royal Airforce and the Ulster Special Constabulary (USC).
Chronology
The conflict exploded into open warfare when Provisional Government forces opened fire on the anti-Treaty headquarters at the Four Courts on 28 June 1922, and the months of July and August 1922 marked the peak for total fatalities. While it is often assumed that the end of the so called ‘conventional’ phase of the conflict in August 1922 marked the end of major combat, our figures tell another story. Fatalities remained high in the autumn and early winter of 1922 as the IRA, having been driven from fixed positions, resorted to more familiar guerrilla tactics. This period, from September to the end of November 1922 (the first guerrilla phase) accounted for over one third of National Army fatalities for the entire conflict. Government forces evidently lost the momentum achieved during the opening phase.
Two thirds of all National Army deaths had already occurred by the end of November 1922. While anti-Treaty fatalities remained numerically steady throughout the conflict, National Army losses began to fall in the winter of 1922. During this period, the growing Free State Army began a more aggressive campaign against the guerrillas, whose ranks were progressively depleted, particularly by incarceration. Executions of anti-Treaty prisoners also began in November 1922. In January 1923 for the first time, anti-Treaty losses (fifty) exceeded pro-Treaty fatalities (forty), and this remained the case for every subsequent month up to the IRA ceasefire.
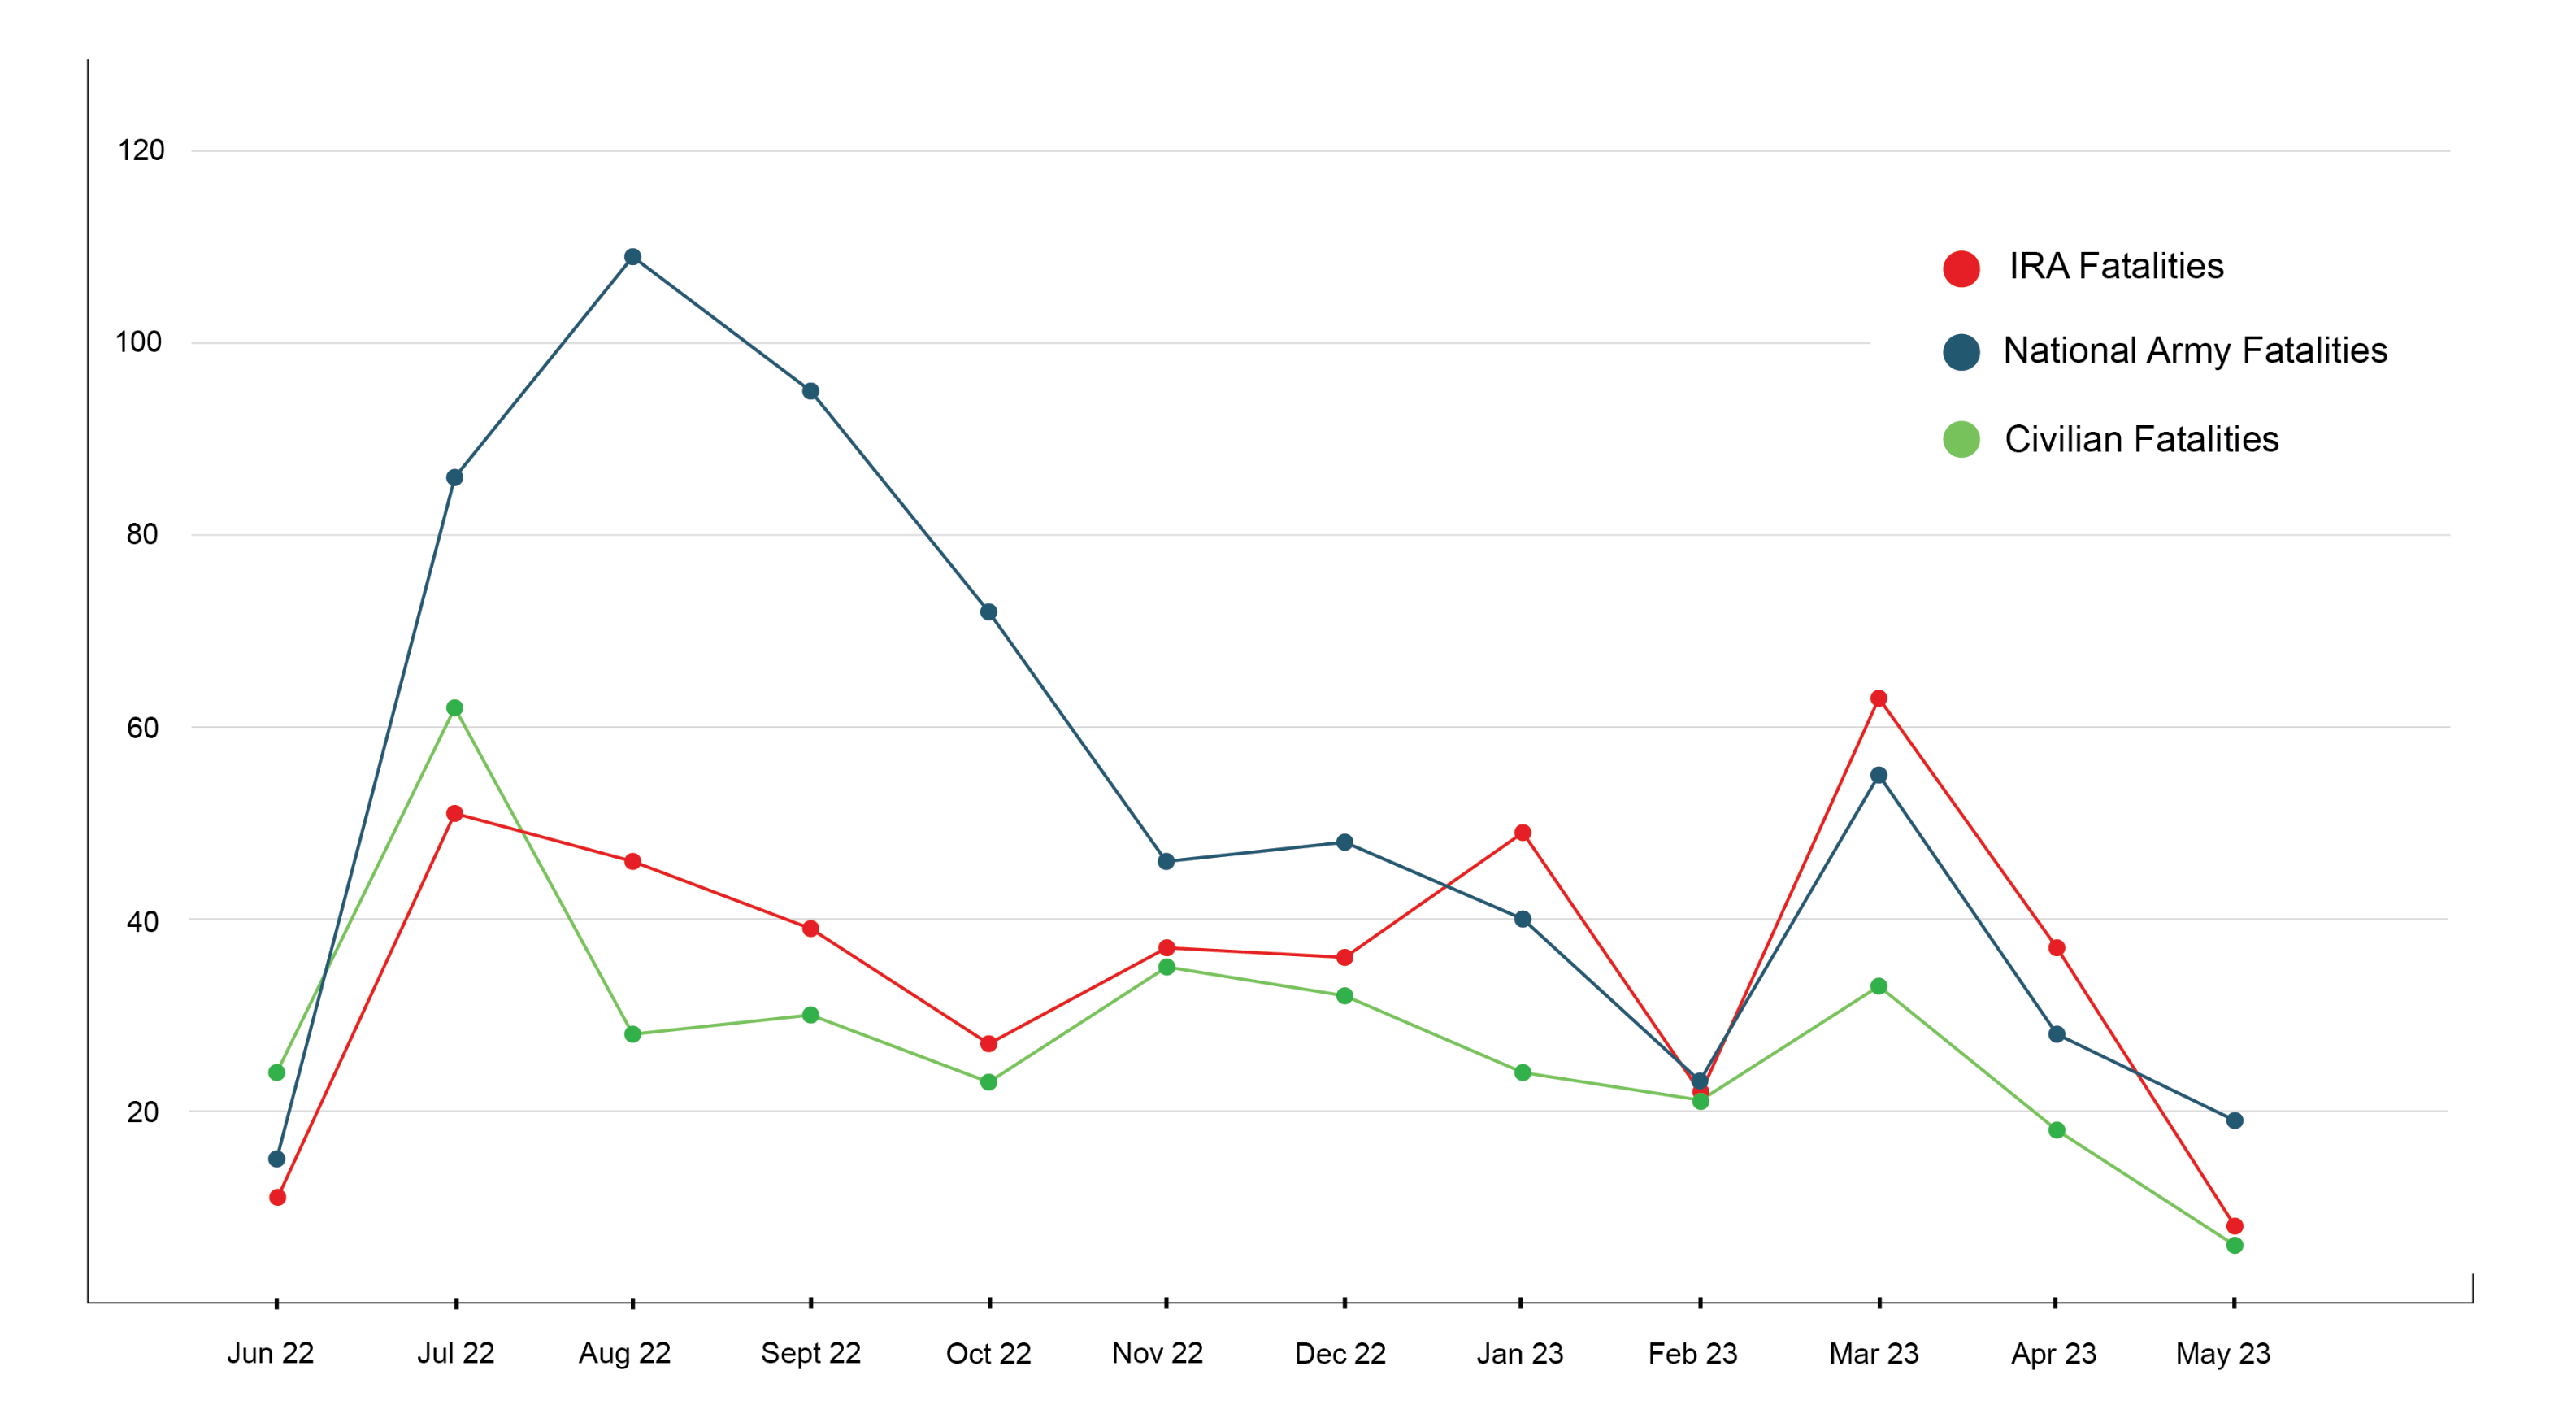
Fig 2. Line graph showing deaths by month in each category (IRA, National Army and Civilian) in the twenty-six counties
The fact that executions increased as overall violence declined reflected two important developments. Firstly, the republicans had switched to non-combat tactics such as burning the houses of Free State supporters and the destruction of communications infrastructure. And secondly, the Free State government’s need to bring the war to a speedy conclusion before it bankrupted the state. A large proportion of the March 1923 victims were the forty-three republican prisoners killed in custody, of whom thirty-two died in ‘unofficial’ reprisals. In total, 58 per cent of republican deaths in the final phase of the Civil War (March to May 1923) were either executions or prisoners killed in custody.
Violence abated in April 1923 as IRA units almost everywhere were demoralised and depleted by arrests and perhaps deterred from further activity by the threat of executions. The most notable casualty in that month was IRA Chief of Staff Liam Lynch, shot as he was fleeing from a National Army sweep in County Tipperary. His successor, Frank Aiken, called a ceasefire on 30 April and, in the absence of any viable negotiated settlement, issued an order to ‘dump arms’ on 24 May 1923. This effectively ended the conflict, though political violence continued.
| Table: Fatalities in each phase in the twenty-six counties as a percentage of total deaths over the entire conflict in each category |
|---|
| Period | Civilians % | NA % | IRA % | Total % |
| Jun-Aug 1922 | 33.9 | 32.9 | 25.4 | 31.1 |
| Sept-Nov 1922 | 26.2 | 33.6 | 24.2 | 28.8 |
| Dec 1922-Feb 1923 | 23.2 | 17.4 | 25.1 | 21 |
| Mar-May 1923 | 16.7 | 16 | 25.4 | 19 |
| Total | 100 | 100 | 100 | 100 |
Geography
The map of all fatalities throughout the Civil War across the thirty-two counties reveals a significant concentration of deaths in and around the major urban centres, notably in Dublin, followed by Cork, Limerick and Tralee. Although all these centres witnessed significant conventional fighting, this was generally short-lived; many were killed in more sporadic confrontations. Other factors drove up the death toll in these locations; they retained a significant share of the old British Army garrison infrastructure, which included military prisons, where most executions and many deaths in custody took place. Garrisons also saw the main concentrations of fatal accidents among the National Army. These centres also contained much of the hospital infrastructure.
The map also highlights secondary concentrations at Dundalk, Waterford, the Curragh, Athlone, Wexford, Sligo and Galway, which shared some of the features that accounted for concentrations in the primary locales. Elsewhere a more diffuse, though notable, pattern of rural killings is apparent in County Kerry, west Cork, south Tipperary and in Sligo and Mayo.
The Munster counties of Cork, Tipperary, Kerry and Limerick, combined with Dublin, stand out as the primary arenas, collectively accounting for 61 per cent of fatalities in the twenty-six counties. Secondary centres in the west, Sligo, Mayo and Galway, and Wexford, Louth and Kildare in Leinster collectively accounted for a further 21 per cent, and the residual 18 per cent of deaths were spread over the remaining fifteen counties of the new state. The distribution of fatalities very strongly correlates with areas where the IRA was mostly anti-Treaty. Counties such as Clare and Longford, where the IRA was mostly pro-Treaty, were quiet during the Civil War. Northern Ireland was quieter still for the duration of the conflict.
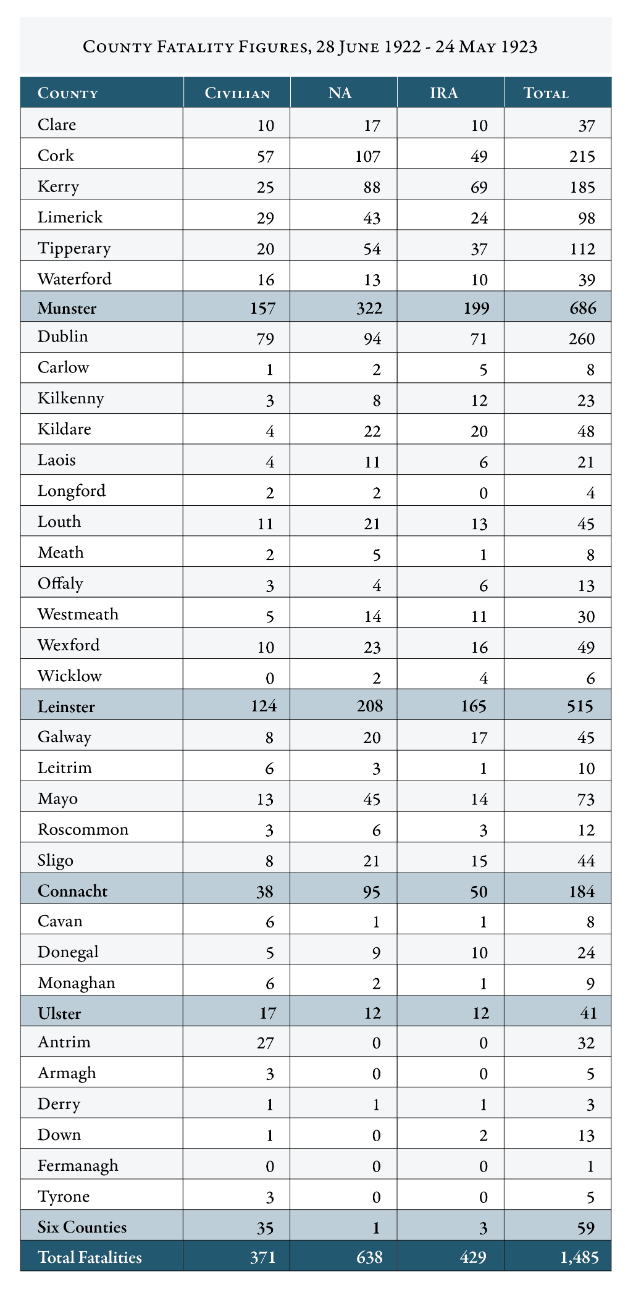
Fig. 3 Table showing fatality numbers in each category in all thirty-two counties between 28 June 1922 and 24 May 1923. Twenty-five of the thirty-two fatalities in Antrim during this period occurred in Belfast.
Fatality levels adjusted for population reveals other aspects of the story. The numbers for Munster are far higher than the other provinces, revealing the conflict was more intense over a wider geographical area within that province. Kerry is revealed as by far the most violent county in Ireland under this rubric, followed some way behind by Tipperary and Limerick. Cork, on the other hand, was lower than the Munster average, despite having the largest number of fatalities in the province in absolute terms. Although Clare and Waterford were low by Munster standards, Waterford was still higher than the Leinster average. Likewise, Clare was higher than the Connacht average and its fatality profile had more in common with that province. In Leinster, Kildare had by far the highest fatality level when adjusted for population; its garrison status contributing to its relatively high death tally. In Connacht, Sligo had the highest level, followed by Mayo, with Galway coming in below the provincial average. Donegal had the highest level in the nine Ulster counties of Ulster, but the province overall had far lower levels of fatalities then the rest of the country on both sides of the border, with the six counties of Northern Ireland at large having a lower fatality level when adjusted for population than all counties in the south.
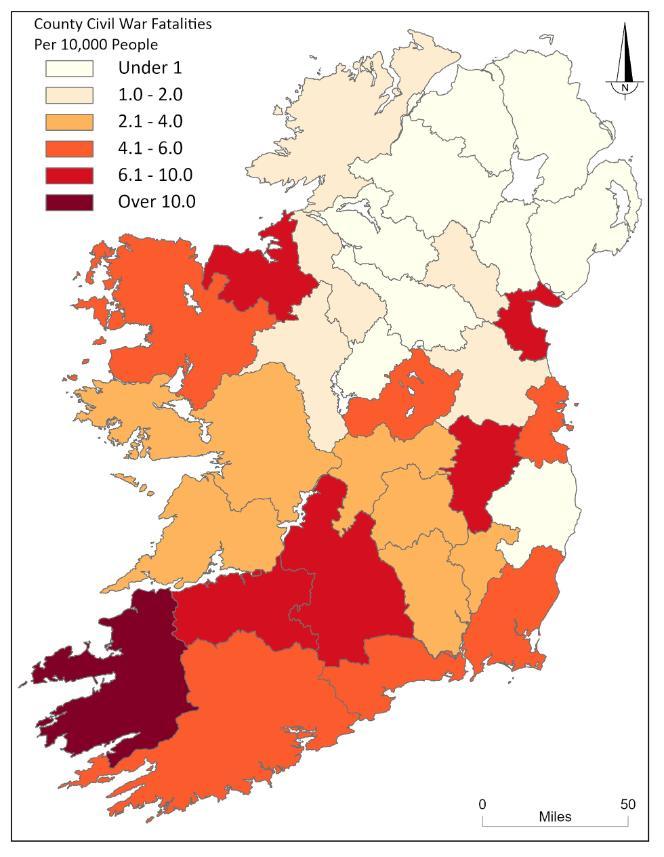
Fig. 5 Map of Civil War fatalities in all thirty-two counties adjusted for population
Causes of Death
One of the more striking differences between the combatants was the share killed in action. While under 42 per cent of IRA fatalities were killed in combat, the corresponding figure for the National Army was over 60 per cent. This can partially be accounted for by differences in how they fought the war. The vast majority of deaths, over 90 per cent, were inflicted by gunshot (from rifles, revolvers and machine guns), but explosives, mostly improvised explosives or ‘mines’, and to a lesser extent grenades, also featured. Though small in number, these incidents involving explosives could cause large casualties in single incidents. The use of trap mines particularly enraged National Army troops, who viewed their use as involving the cowardly murder of defenceless soldiers, and often led to reprisals, including the worst atrocities committed by the National Army.
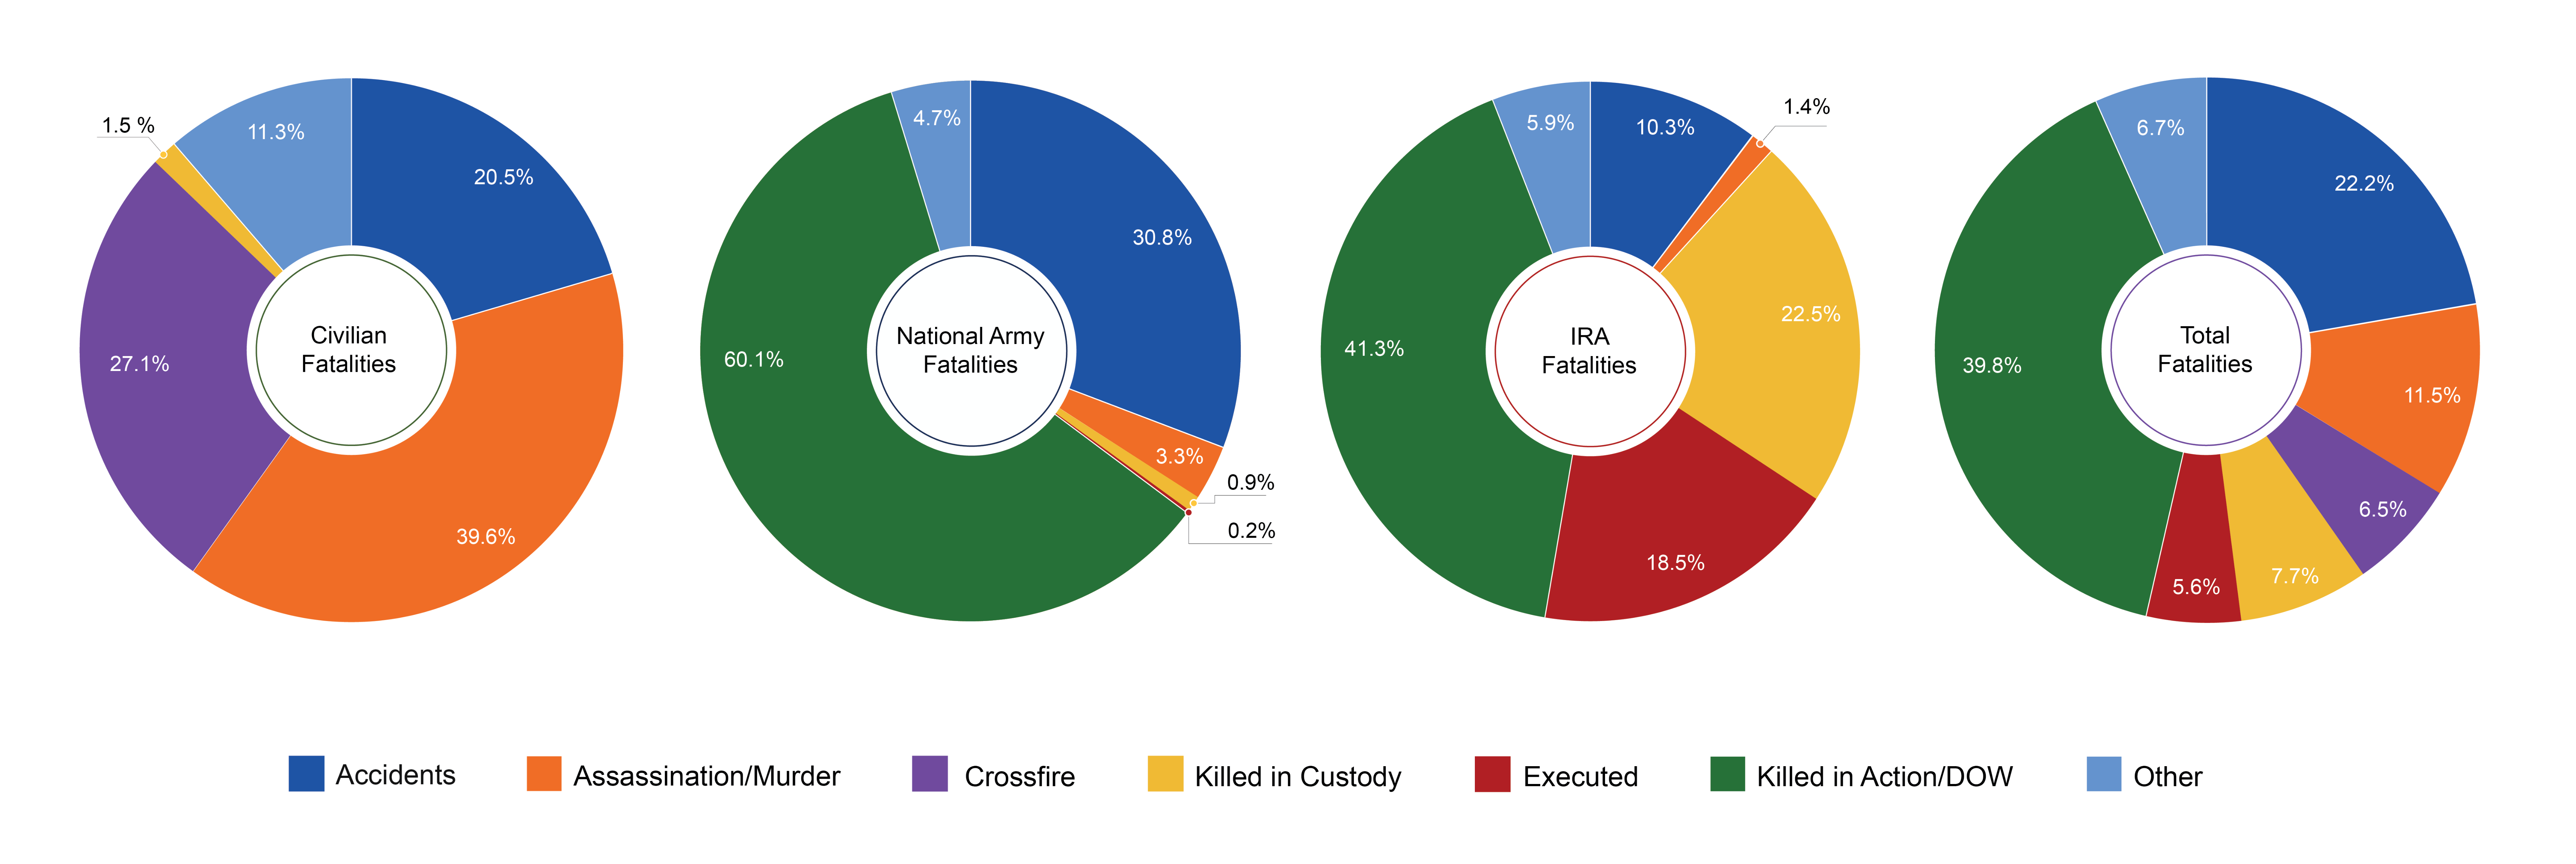
Fig 6. Pie charts showing cause of death in each category in the twenty-six counties between 28 June 1922 and 24 May 1923
Apart from combat, most pro-Treaty deaths were the result of accidents, which took an alarmingly high toll on National Army soldiers. Firearms, explosives or motor accidents and ‘friendly fire’, collectively accounted for almost 31 per cent of pro-Treaty fatalities. Anti-Treaty IRA volunteers were less prone to accidents than their opponents, presumably because they had fewer weapons, explosives and transport at their disposal. Nevertheless, just over 10 per cent of IRA fatalities were the result of accidents. Headline figures for republican deaths include 41 per cent executed or killed in custody, which greatly shaped republican memory of the conflict. Formal executions began in Dublin in November 1922 and were concentrated there until later in 1922 when government policy spread them out across the main garrison towns, where they also acted to deter guerrilla attacks. We have also identified at least 109 ‘unofficial’ executions, carried out by pro-Treaty personnel.
Social profiles
Our research provides a useful sample of the social profiles of combatants who were typically young, adult and male. Almost 74 per cent of the National Army dead and just under 82 per cent of Republican dead were aged between 20 and 34. The occupational profile of the dead indicates that there were some social differences between the two sides. National Army soldiers were more likely to have lower social status, with almost half of the fatalities recorded as having unskilled occupations, compared to less than one third for anti-Treaty victims. Conversely, there was a higher share of skilled workers, tradesmen, and lower professionals (such as clerks, teachers, and civil servants) in the IRA. Over 21 per cent of IRA fatalities were either farmers or their sons, in comparison to under 9 per cent of National Army soldiers. This suggests that the latter recruited primarily from among the urban and rural poor, whereas IRA members came from a broader cross section of society. IRA volunteers joined a mostly unpaid guerrilla army, for a range of political and social motives, but rarely for employment. Pro-Treaty IRA members came from similar backgrounds, and many did join the Free State forces out of political conviction, but more National Army recruits were poor men in need of a steady income.
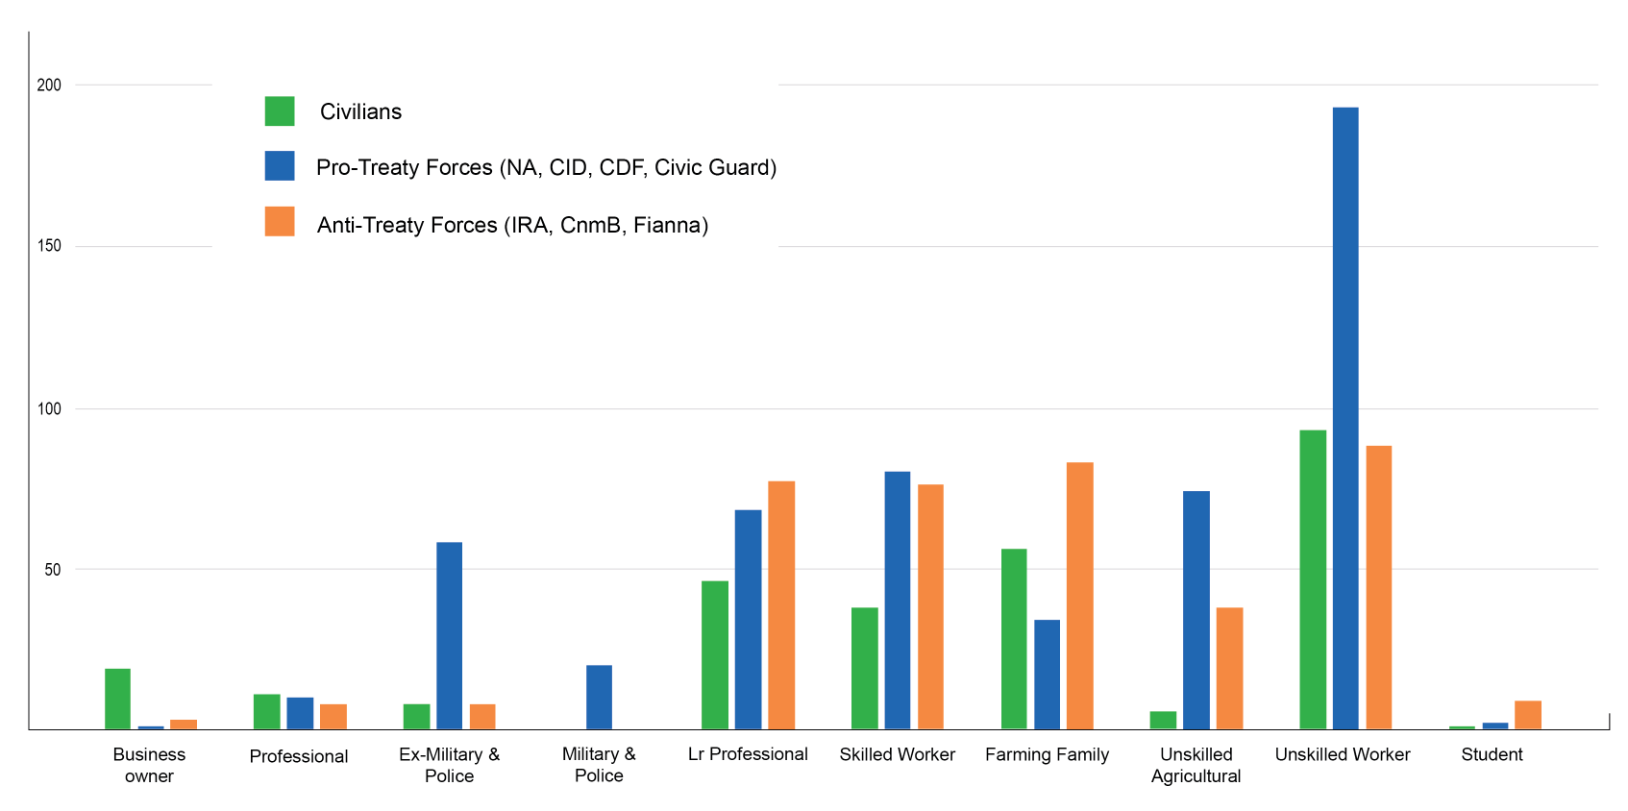
Fig 7. Bar chart showing the ten categories of employment for the civilian, pro and anti-Treaty fatalities
Previous Service
Part of the anti-Treaty republican narrative of the Civil War is that its volunteer soldiers were overwhelmed by the vast numbers of former British Army veterans recruited by the pro-Treaty side. In recent years, historians have concurred, suggesting that about half the rank and file in the National Army were ex-British soldiers.
Our data on the previous service of National Army fatalities, however, revealed that less than 17 per cent were recorded as ex-servicemen. Its also suggests that a higher share of National Army fatalities, 23 per cent, were ex-IRA or Na Fianna with pre-Truce service. A far higher share still, some 60 per cent, had no previous affiliation or military service. The latter finding accords better with evidence of poor overall National Army discipline and performance in the Civil War, despite its superior resources. This implies that the share of ex-servicemen in the ranks of the National Army requires further research. By contrast, under 5 per cent of the anti-Treaty dead had served in British forces and most of these also had pre-Truce IRA service. Indeed, 74 per cent of republican fatalities had been members of the IRA, Na Fianna or Cumann na mBan, before the Truce in 1921.
| Table: Previous Service of Civil War Combatants in the Twenty-Six Counties |
|---|
| Anti-Treaty (IRA, Na Fianna Éireann, Cumann na mBan) | Numbers | % of Total |
| Pre-Truce republican service only | 306 | 69.9 |
| Former British service only | 9 | 2.1 |
| Pre-Truce republican and former British service | 19 | 4.3 |
| Unknown / No previous service | 104 | 23.7 |
| Total Anti-Treaty | 438 | 100 |
| Pro-Treaty (National Army, CID, CDF, Civic Guard) | Numbers | % of Total |
| Former IRA or Fianna only | 162 | 25 |
| Former British service only | 107 | 16.5 |
| Former IRA and British service | 6 | 0.9 |
| Unknown / No Previous service | 373 | 57.6 |
| Total Pro-Treaty | 648 | 100 |
Fig. 8 Table showing the pre-Civil War service of pro- and anti-Treaty and civilian fatalities in the twenty-six counties. 'Republican Service' includes previous service with the IRA, Cumann na mBan, Fianna Éireann or the Irish Republican Police (IRP). 'British Service' includes previous service in the British Army, the Royal Air Force, the Royal Navy, the Royal Irish Constabulary, the Dublin Metropolitan Police, and in the case of one IRA member and one National Army soldier, the Australian and Canadian military services, respectively. Among the combatant fatalities, 104 anti-Treatyites and 373 pro-Treatyites are listed as having ‘unknown/no previous service’. As previous service was recorded in the Military Service Pension Files, this almost always means no previous service. Those combatants who died during the Civil War represent a small percentage of those who served. Nevertheless, the data here on previous service challenges a number of preconceptions on the conflict, such as the alleged predominance of ex-British servicemen in pro-Treaty ranks and 'trucillers' in anti-Treaty ranks.
County of Origin
The origins of combatant fatalities also challenges some popular perceptions about the protagonists. On this metric, Dublin again stands out, mainly as it was the National Army’s primary recruiting ground. Over three times as many Dublin men died in National Army service as in the IRA, many of them in other counties scattered across the Free State. In County Kerry, in contrast, more than twice as many local men died in the IRA as in the National Army. In Tipperary and Waterford, locally born republican deaths also outnumbered pro-Treaty ones, though to a lesser extent. In contrast, Corkonians who died in Free State uniform outnumbered those who died for the republican cause and the same pattern holds for counties Clare and Limerick. The significance of local National Army recruitment once it had established a foothold has perhaps been underestimated.
Outside of Munster, the only Free State counties with a significant death toll where local anti-Treaty casualties outnumbered those on the pro-Treaty side were Louth and Wexford. Over 100 people from the nine counties of Ulster died in the twenty-six Free State counties in the Civil War and again, over three times as many of these died in the pro-Treaty forces as in the IRA.
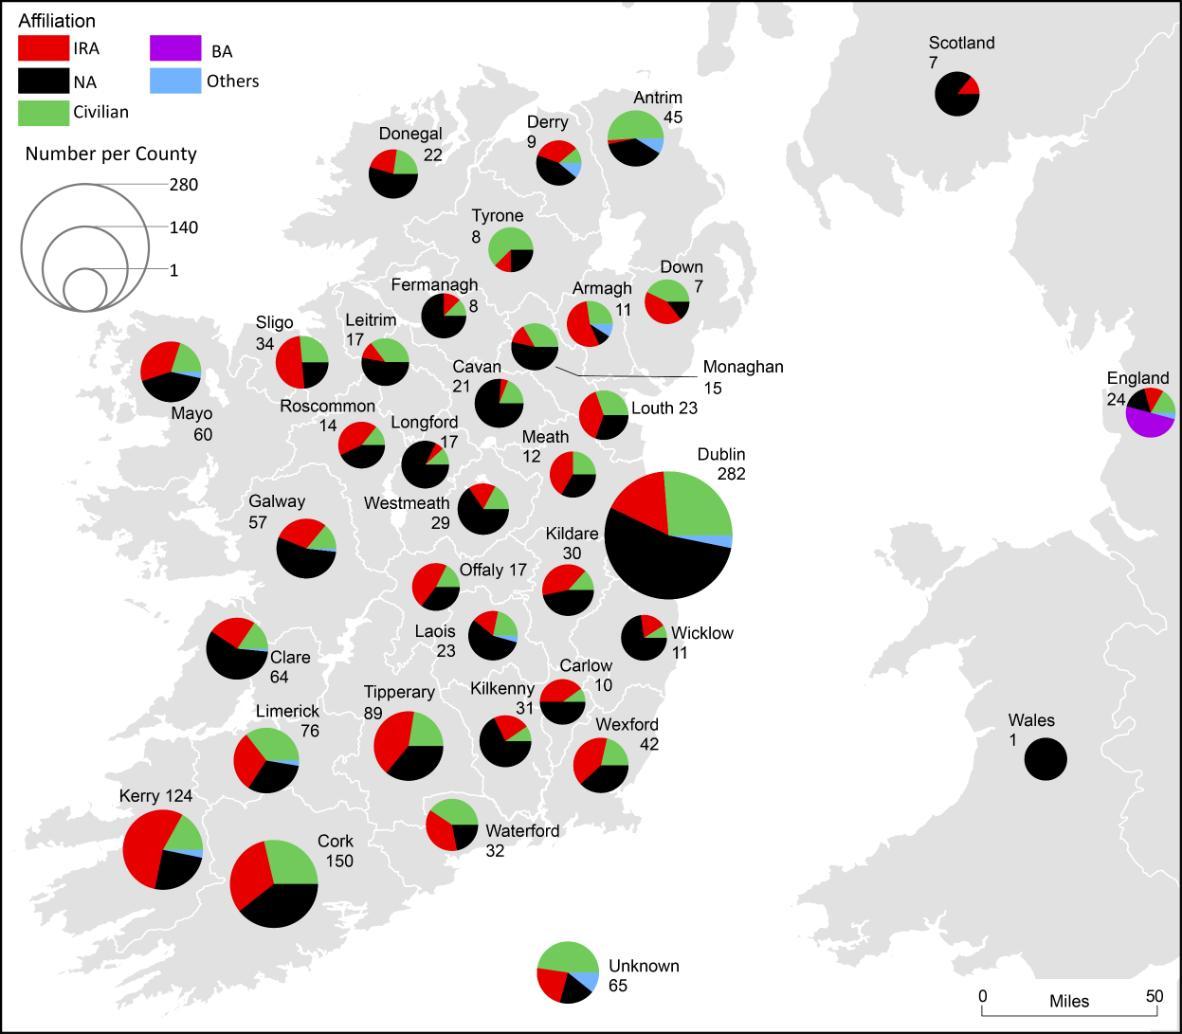
Fig. 9 Map showing the County of Origin of all those killed as a result of political violence in the thirty two counties between 28 June 1922 and 24 May 1923
Conclusions
The figures generated by this project reveal that fatalities between 28 June 1922 and 24 May 1923 were somewhat lower than during the War of Independence. Our total of 1,485 violent deaths on the island (with only fifty-nine in total in Northern Ireland) are more modest than those advanced by a previous generation of historians, even allowing for further deaths in the prelude and aftermath of the conflict. In terms of indiscriminate violence, therefore, the Irish Civil War was by no means more terrible than what had gone before.
Read More
Read more about the main findings under each category


