
Projects and News
CSG & The VQ release the October VQ Mobility Report.
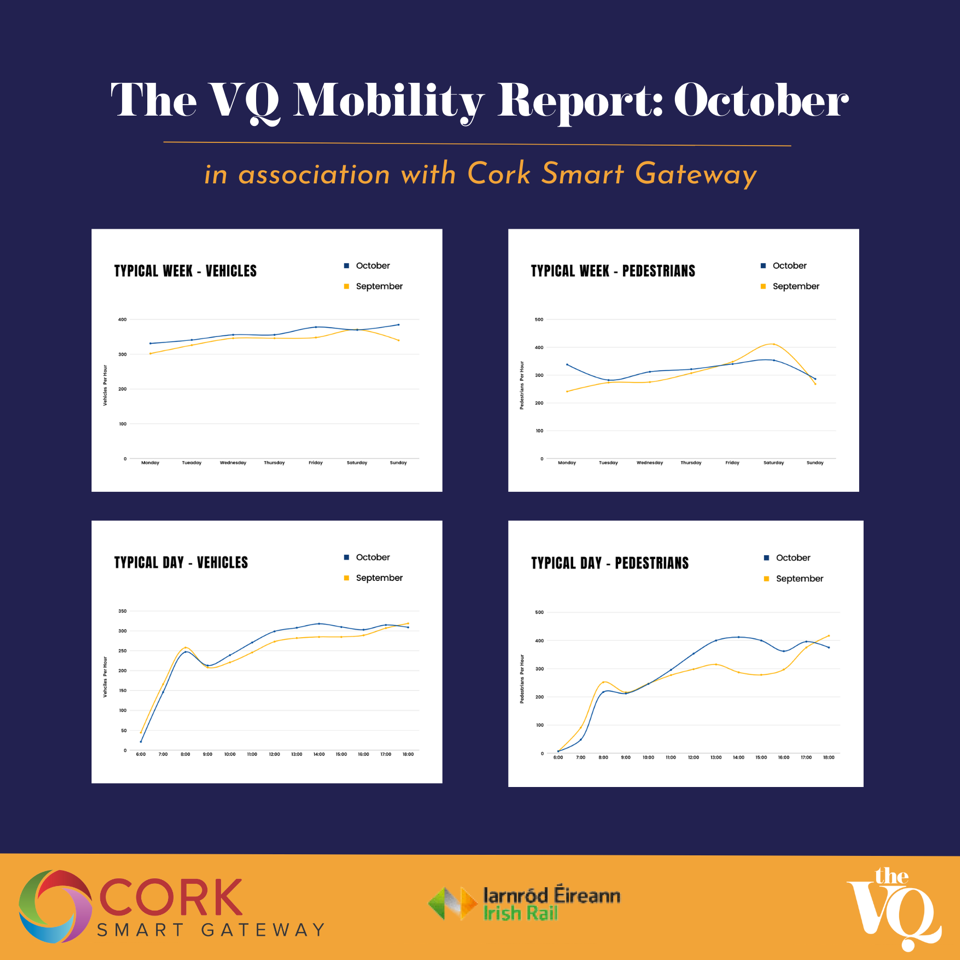
The October figures for the VQ are in. In this edition we have compared the weekly and daily trends for October and September to give more detailed insights.
The October figures for the VQ are in. In this edition we have compared the weekly and daily trends for October and September to give more detailed insights. As each month passes we will be able to build up a comprehensive picture which will show how mobility patterns in the area change over time.
Overall, comparing October to September, there was an 11% increase in pedestrian number and a 4% increase in traffic volume.
We have also included the Kent Station passenger numbers running up until October 2024. These figures reveal the significant and consistent increase in passenger numbers on all routes, an encouraging sign for local Cork City businesses and evidence that people are increasingly using public transport to travel to and from Cork City. Many thanks to Stephen Hackett and Iarnród Éireann Irish Rail for their collaboration and providing the data.
If anyone would like to get involved in the project to provide or help gather more data sets please get in touch.