
Dashboard
What is Tableau Public?
Tableau Public is a free platform to explore, create, and publicly share data visualizations (or vizzes, as we affectionately call them) online. Anyone can create vizzes using our in-platform web authoring or Tableau Desktop Public Edition for free. Those with Tableau Desktop Professional Edition can also publish to Tableau Public for free. With millions of inspiring data visualizations to discover and learn from, Tableau Public makes it easy to develop your own data skills and create an online portfolio of work. Join the Tableau Public community where you can grow and learn from each other while making data a part of your everyday life.
With millions of interactive data visualizations made by over a million creators around the world, Tableau Public allows you to explore the art of what’s possible with data on any topic from music to sports to politics. Browse our curated channels of community-created vizzes, or search for topics by keyword with the help of hashtags. Visualizations on Tableau Public can be downloaded or explored in any browser. Quickly see how a viz was created and make a version of your own. Add the visualizations that inspire you to your Favorites channel to build a collection of vizzes that you can revisit anytime.
How to use Tableau
A step-by-step guide to get you started on your own data viz journey can be found at https://www.tableau.com/blog/beginners-guide-tableau-public
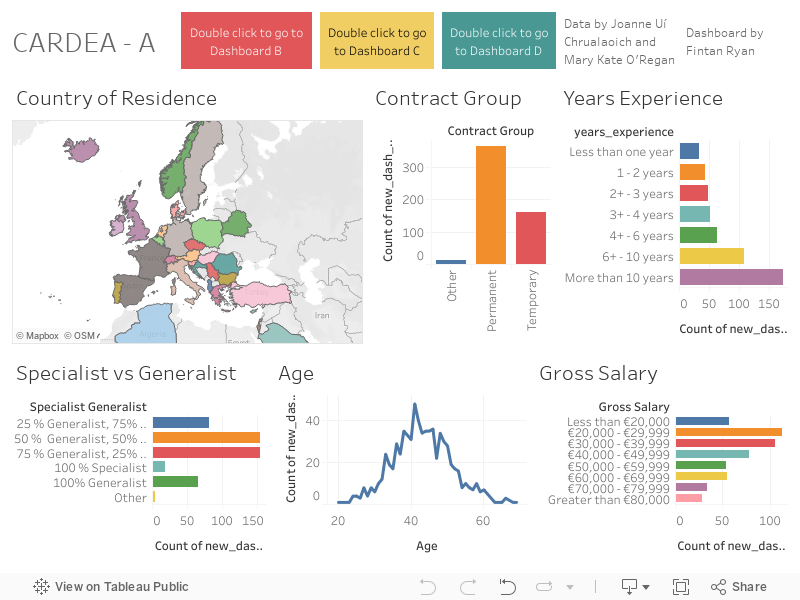
CARDEA Dashboard
The following dashboard is divided in three sections: A, B and C. Please click on the available buttons to move from one section to the other. The three sections provide an overview of Research Managers profiles across Europe and beyond. Data are mostly concerned with background information and details regarding work experience, salary, professional skills and job security.
If you can't see the dashboard embedded below, you can visit the full dashboard on tableau.com
RM Professional Development Opportunities
ABOUT
This dashboard has been developed as a collaborative endeavour between the CARDEA project and the RM-ROADMAP project, and serves as a comprehensive hub for RM professionals seeking professional development opportunities. It offers easy access to a wealth of data collected under the RM-Roadmap project, showcasing a wide range of opportunities across Europe, including training, mobility, networking, and funding options tailored to RMs.
To help you navigate the dashboard, here you will find information on how the dashboard is organised, the terminology used, etc.
The anonymised data used as basis is available on Figshare should you wish to explore/discover/use.
A report containing more details about the project as well as analysis of the data collected is also available here: Deliverables — RM ROADMAP Project Home.
For any information about the contents of the dashboard, please feel free to contact rm-roadmap@novaims.unl.pt.
CONTACT DETAILS
For any information about the contents of the dashboard, please feel free to contact rm-roadmap@novaims.unl.pt.
![]()
