How to measure the demographic impact of a pandemic 19 Aug 2020
Analysis: New research on the Spanish flu in Ireland shows how pandemic mortality rates are sensitive to a country's demographic make-up
By Dr. Eoin McLaughlin, CUBS/ERI/UCC and Chris Colvin, Queen's University Belfast
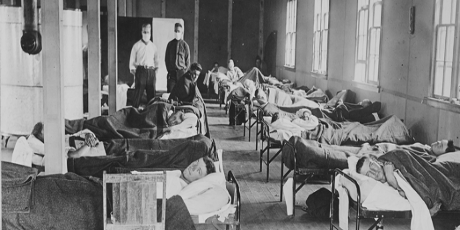
A major comparison for Covid-19 is Influenza-18, more commonly known as the Spanish flu. It is now being widely studied again and referred to both in academic and popular writing. The Spanish flu was notably even referenced, albeit incorrectly, by the US president. However, to fully extrapolate relevant policy lessons, we must first develop a more sophisticated understanding of the population-at-risk in 1918. This means taking account of changing demographic composition of populations during the 1910s, a turbulent decade.
The Spanish flu infected one-third of the world's population and may have had a death toll between 50 and 100 million, 2.64 million of which were in Europe – 1.1% of the continent’s population. Like Covid-19, the impact of this early 20th century pandemic was so great because the influenza A virus subtype H1N1 which caused the disease led to secondary bacterial pneumonia and respiratory failure.
There are a number of demographic oversights in the current literature which limit our understanding of the 1918 pandemic here and elsewhere. One is acknowledging the stage of the epidemiological transition in which the world found itself. Infectious diseases were still rampant and background (endemic) mortality rates were high relative to today. Ireland’s crude death rate in the 1910s was three times higher than it is in the 2010s. In this sense, Ireland’s experience of Influenza-18 is more similar to the experience of Southeast Asian countries today, which have been better prepared because they have had recent SARS outbreaks.
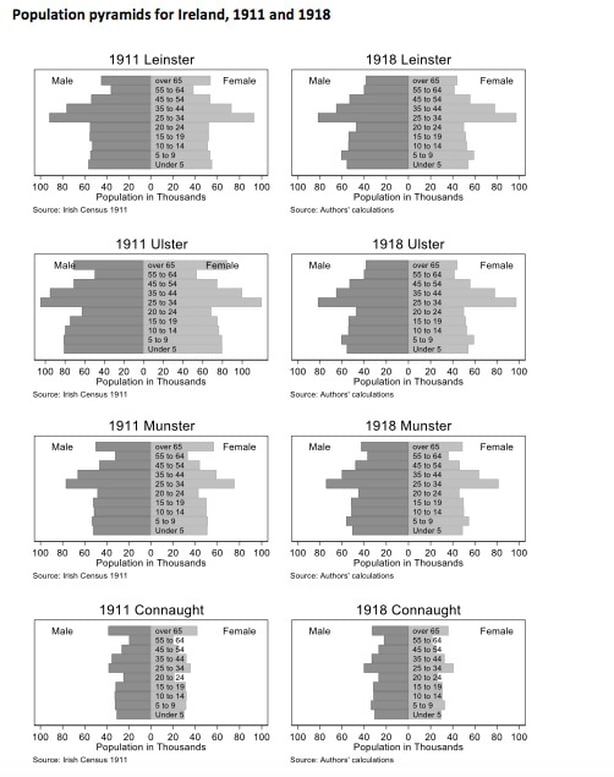
Another difference to today is the age and sex composition of the population. The most prominent driver of demographic change in the early 20th century was World War I. Army enlistment from urban centres reduced the male population in the 20 to 40 year old demographic, the exact population identified by epidemiologists as being particularly susceptible to 1918's influenza strain. Indirectly, this led to a drop in births during the war years; births rates fell from 23 per 1,000 in 1911 to 20 in 1918.
Traditional emigration flows also dried up. Generations of emigration flows had left an indelible mark on the countryside's demographic structure. Rural areas were notably older, which is the population group typically identified as being less affected by the Spanish flu.
We need to take account of the differences in age in order to make meaningful comparisons across the island and between countries. For example, if Dublin had a higher crude mortality rate during the influenza pandemic than Mayo, but Dublin also had a higher share of the population under five years of age, then we cannot make a comparison without controlling for this difference. This adjustment is know as age standardisation.
From RTÉ Radio 1's Today Show, Spanish flu historian Ida Milne on what we can learn from history (item begins at 0.44)
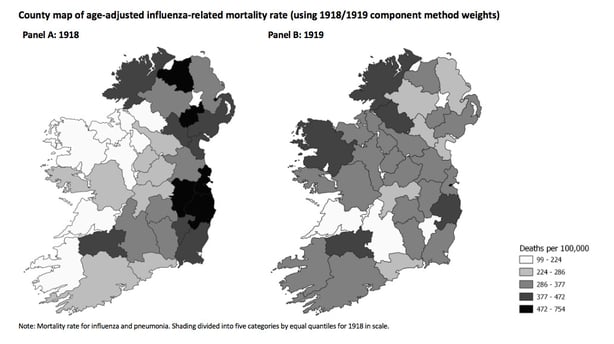
The impact of the Spanish flu on Ireland was first quantified by Ireland's then-Registrar-General, Sir William John Thompson, in an article published just after the pandemic ended. He estimated an influenza mortality rate of 243 per 100,000 in 1918, with urban areas experiencing a rate of 370 per 100,000. More recent studies by Ida Milne and Patricia Marsh highlight how official figures underestimate the pandemic's impact because of misclassification of deaths. These studies suggest a higher pandemic death toll of up to 782 per 100,000 population.
To calculate the mortality rate requires a denominator: the relevant population, the average population exposed to risk of death during the defined time period. Up-to-date population estimates are necessary for a variety of administrative indicators, such as vital statistics and disease incidence. Existing studies all use the population taken from Ireland’s most recent census, conducted seven years before the pandemic, in April 1911.
Using the 1911 census means Thompson and the others choose not to take account of changes in population due to births, ageing, migration and deaths since 1911. Irish scholars of the Spanish flu are not alone in their choice to use the closest census. Around the world, the most recent census year to the 1918-1919 pandemic were typically around 1910 (pre-pandemic) or 1920 (post-pandemic), and so this same under- or over-estimation of the denominator is being repeated across the entirety of this literature.
New historical statistics
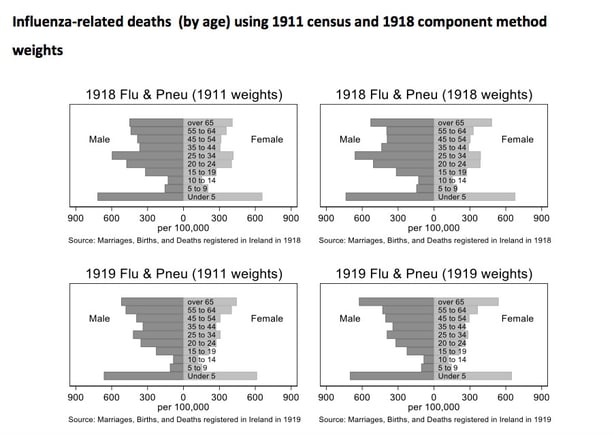
Instead of relying on the census, we re-estimate the 1918 and 1919 county population of Ireland using what demographers call "component method" that takes account of vital statistics (births, deaths, emigration) from the 1911 onwards. Using our new population estimates, we highlight several key features of the Spanish flu pandemic in Ireland. We reveal the detrimental impact on the youngest in society – the inverse of the Covid-19 death toll. Influenza deaths were 30,000 in 1918 and 1919, implying age standardised death rates of 390 per 100,000 in 1918 and 329 in 1919.
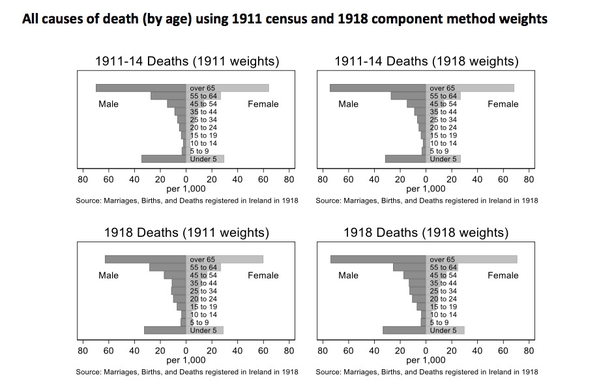
We also reveal that excess mortality statistics tell a different story. Mean annual deaths were 72,706 between 1911 and 1914; 1918 saw 78,695 deaths and in 1919 the total was 78,612. So total excess deaths over both years was 11,895, considerably lower than the raw total influenza and pneumonia death counts.
The prevailing high mortality environment in which the pandemic occurred may account for this surprising finding. Influenza crowded out other causes of death; people that would likely have died of something else, a phenomenon known as the harvesting effect. The excess mortality per capita was 163 per 100,000 in 1918 and 115 per 100,000 in 1919. Adjusted for age, the figures are 223 and 123 per 100,000, respectively.
Lessons for today
Our findings from Influenza-18 are relevant for the study of the impact of Covid-19. While important real-time commentary on mortality using notices from RIP.ie has suggested heightened regional mortality, they have not adjusted for population or age in their comparisons. Another possible indicator that needs to be addressed are cultural; immigrant populations may not use RIP.ie as readily as the Irish population.
When comparisons of the death toll in the Republic and Northern Ireland are made, there is little discussion of the fact that the latter has a distinctly older population as of the latest census. Similar problems arise with international comparisons: The Irish Times recently reported that Ireland had a higher per capita Covid-19 death rate than the US, but no account was made of the differences in recording of deaths and the age structure of both countries.
This is in no way intended to devalue the lives lost amongst the older population, or to imply the higher death toll is some how more acceptable based on the age of the deceased. But in order to meaningfully compare our progress and failings across the island and further afield, we need to adjust for demographic characteristics of geographic regions.
This piece is based on a forthcoming paper, Death, Demography and the Denominator: New Influenza-18 Mortality Estimates for Ireland, by the authors
Dr Eoin McLaughlin is a Senior Lecturer in Economics at the Cork University Business School in UCC. He is a former Irish Research Council awardee. Dr Chris Colvin is a Senior Lecturer in Economics at the Queen's Management School at Queen's University Belfast