How do you measure the size of a once-a-lifetime storm? 29 Jan 2025
Analysis: Few places in Ireland have weather records going back over 100 years to allow the size of such events to be measured directly
By Enda O'Brien, ICHEC; Páraic Ryan and Paul Holloway, UCC
Dr Enda O'Brien is a Senior GIS Computational Scientist at the Irish Centre for High-end Computing. He is currently managing the Met Éireann-funded research project TRANSLATE. Dr Páraic Ryan is a Senior Lecturer in Civil Engineering at UCC and a Conjunct Research Fellow at the University of Newcastle, Australia. He is a Research Ireland awardee. Dr Paul Holloway is a Lecturer in the Department of Geography and a Principal Investigator in the Environmental Research Institute at UCC. He is a Research Ireland awardee.
The concept of a "100-year storm" or "100-year flood" refers to events that are so large and so rare that they are expected to happen on average just once every 100 years. But few places in Ireland (or anywhere else) have records going back over 100 years that allow the size of such events to be measured directly.
So how can we estimate the size of those 100-year events? Put another way, what size events have a 1% probability of occurring in any given year? Or we can flip the question and ask, after a particularly large storm or flood, what is its "return period"? How many years are likely to pass before it happens again? And how can we detect how such events are changing?
Those are not just idle questions asked out of mild curiosity. The design standards for many components of our national infrastructure require that they be able to deal with events with specific return periods, be it five, 50 or even 100 years. For example, Transport Infrastructure Ireland requires that the pipe network draining major roads should manage rain from five-year events with flooding, while the associated attenuation ponds are designed for 100-year events.
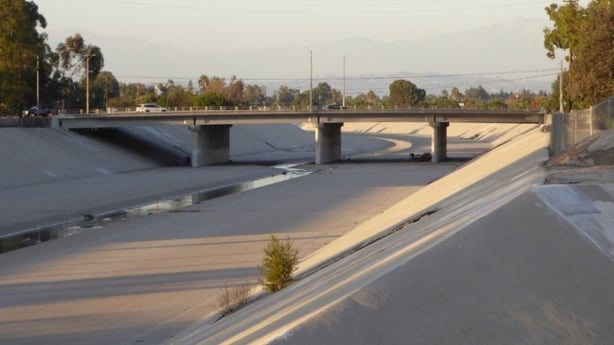
Some highly visible consequences of these standards can be seen in Los Angeles, where storm drains built by the US Army Corps of Engineers are designed for 100-year events. These drains are broad open concrete channels, usually with just a trickle of water in the gutter in the middle. They make good settings for car chase scenes in movies like Grease, Terminator II or Drive. Southern California has a mostly dry climate, so these channels are dry almost all the time, but their massive carrying capacity is still determined by the estimated size of the 100-year rainfall event in the Los Angeles area.
Coming up with official size estimates for those 100-year rainfall events is quite a responsibility and the methods used need to be justified as rigorously as possible. As mentioned above, however, high-quality rainfall data records for most weather stations are available only since the end of World War II, making them only about 80 years long at most.
An intense storm (one with over 100 mm rainfall in a day) occurring just once during those 80 years doesn't necessarily make it an 80-year event, but its underlying return period could be anywhere between 80 and 800 years or even longer. To stretch the old Dublin bus analogy a bit, these rare rainfall events might not appear for hundreds of years, and then two or three could arrive together within a single decade. Even if robust statistical methods are available to do it, generating a usefully narrow range of estimates for the size of a canonical "100-year event" will always retain some uncertainty.
A simple but effective trick to estimate the size of 100-year storms from just 30 years (or less) of data is, in a word, extrapolation. The number of storms from those 30 years of data are counted and plotted as a function of storm size, where "size" is measured by rainfall amount within a narrow range (or "bin") over a short time interval like an hour, or a day. A smooth curve is then fitted to those data, and simply extrapolated out to larger sizes – and so to longer return periods.
There is some fuzziness in how to choose the best "fit" to the data, and this can lead to slightly different extrapolations, but the basic idea of extrapolation remains, and has been well validated in several different contexts.This means that we can plot the return period (in years) for any intense rainfall event as a function of event size (in mm) given observed historical data, along with a model that runs smooth curves through it.
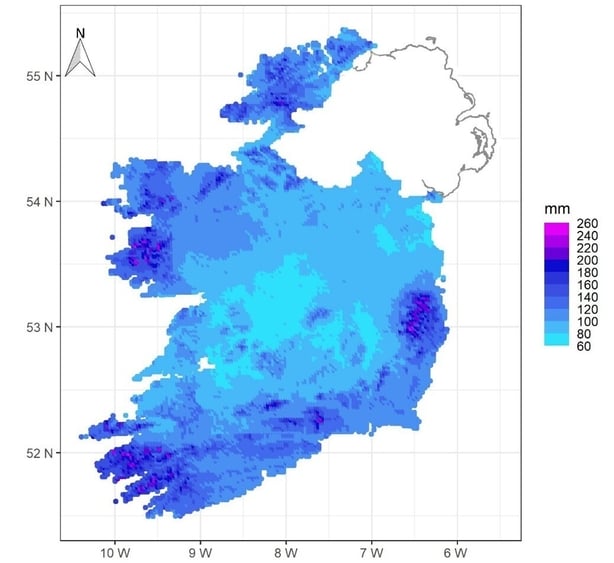
This is how Met Éireann can produce a map of Ireland showing the one-day rainfall amounts that have 120-year return periods. It is also why Met Éireann could write, in reporting on a very intense storm that dumped over 100mm of rain over parts of Kildare and Dublin on June 11th 1993: "This was a most remarkable fall for lowland areas in the east, being over twice the long-term average for the whole of June. In terms of return periods the 12-hour rainfalls had a return period of over 100 years and the 24-hour totals a return period of some 250 years at Casement Aerodrome (Baldonnel). …the totals at some Dublin – Kildare stations were the highest ever, exceeding even those of 'Hurricane Charley' in August 1986, when Wicklow and much of the Dublin mountains had heavier falls than in this event."
What can be counted in historical, observed data can also be counted in climate model projections of the future. This work is still underway, but initial results for plausible future climates show significantly shorter return periods for events of a given size.
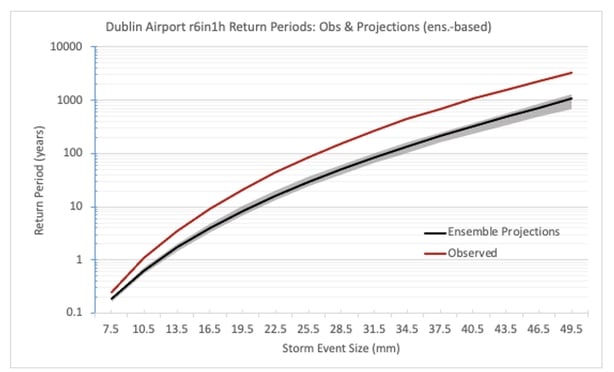
In these charts for Dublin Airport, the observed relationship between event size and return period during the last 80 years or so (the red curves) are projected to look more like the black curves by the end of this century if greenhouse gas emissions continue on their historical (and still current) trajectory.
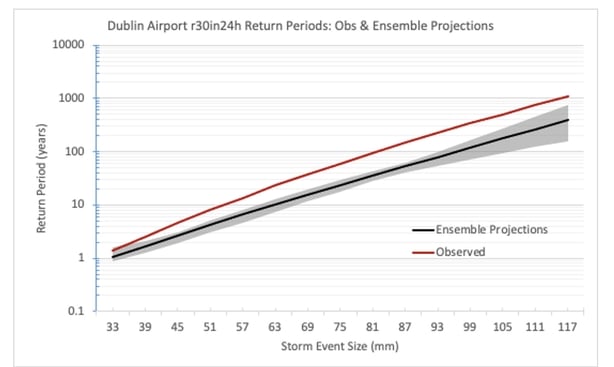
One chart plots events lasting one hour, the other plots events lasting one day. By reading where the red curves cross the horizontal 100-year return period lines, we can see that while 26 mm in an hour would have been a 100-year event at Dublin Airport in the past, this amount of rainfall could well be more like a 30-year event by the end of the century. Similarly, 80mm in a day could change from being a 100-year event in the past to a 30-year event by the end of this century.
Looking at those charts another way, they show significantly more rainfall in future events. The story told by those charts (and for other locations around Ireland) is quite clear and consistent with lots of other research. Everyday changes in climate will be relatively small but pervasive, while changes at the tails of the distributions will be much larger, and not quite so rare or infrequent. Truly, much of the sting of climate change will be in those tails.