- Home
- About
- Student Led
- Research Informed
- Practice Focused
- Resources
- News
- Green Campus Podcasts
- Case Studies
- Green Labs Community
News
Energy Performance February 2023 (Enter draw for Home Energy Monitor)
Hello All and welcome to our monthly energy blog where we communicate UCC’s energy performance for the month of February and the Academic Year.
Electrical
Electrical consumption for the month of February came in at 1.3 GW/h (enough energy to power 3,500 homes for the month.) down 9% on our baseline period of February 2019, a fantastic performance from everyone who have helped us reduce our use.
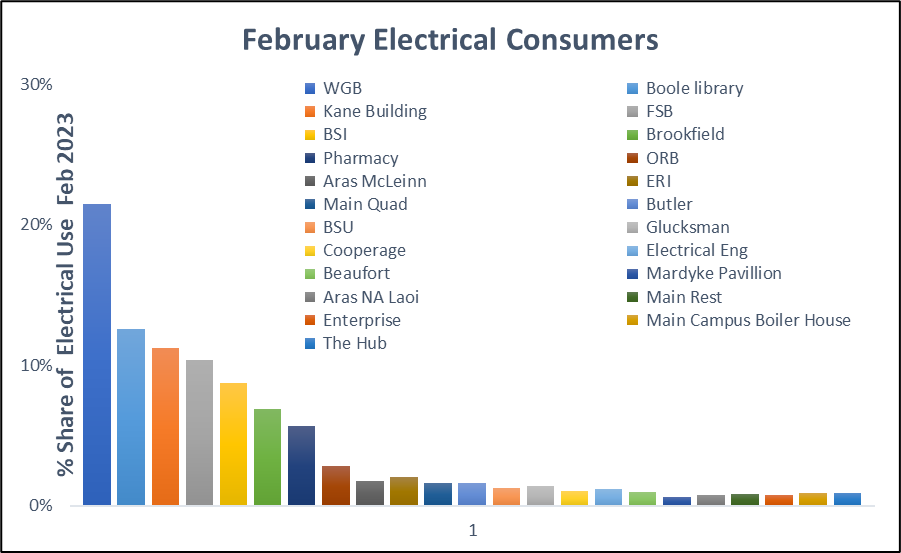
Chart 1 : Shows the Spread of Electrical Users across the Estate
WGB continues to be UCC’s most significant energy user, accounting for just over 22% of our electrical use. The team at WGB continue to optimise the building systems and is currently running 37,000 kwh below previous levels (see chart 2). The Kane and Boole Library buildings energy use has increased significantly on the baseline period which was expected but overall, the Estate is running 393,000 kWh below the baseline period.
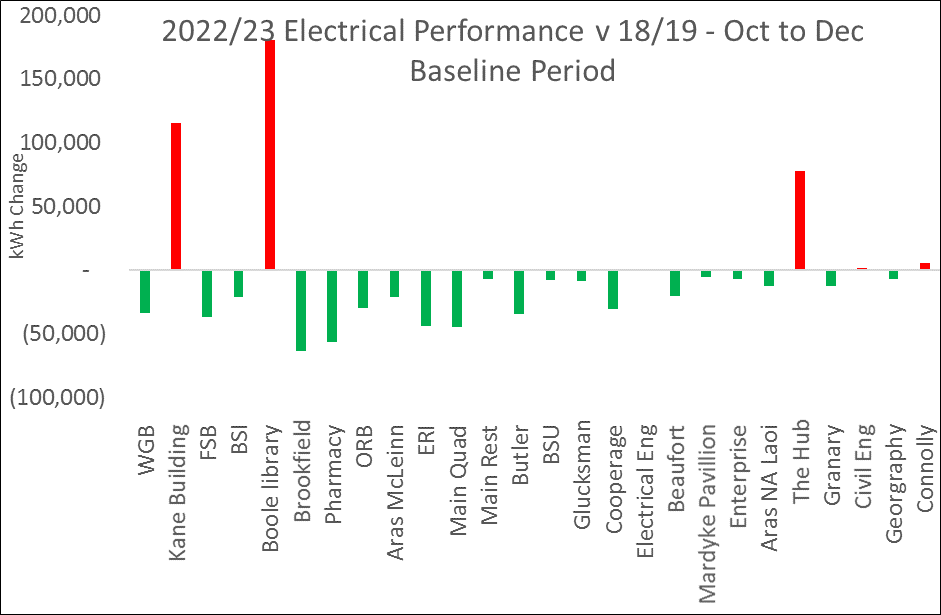
Chart 2 – kWh Change Oct – Feb compared to same period 2018/19
The annotated graph 3 shows the typical hourly electrical use over February. When buildings are closed the electrical load averages around 1,300 kWh and this is largely consumed by lab and IT equipment. Consumption starts to increase from 05.00 as the heating systems are fired up, heating pumps are turned on and catering operations start up in the Main Rest. At 07.00 the ventilation systems are enabled, and general services commence building opening patrols. Peak electrical consumption is typically reached at 11.00 and continues until around 15.00. As the working day comes to an end and class numbers reduce the electrical profile starts to decrease while heat pumps are switched off between 17.00-19.00. By 21.00 consumption reduces further when evening classes come to an end and ventilation systems are switched off and general services begin to close the buildings.
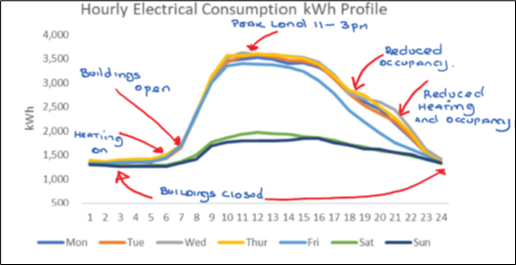
Chart 3 – Typical Hourly Profile over February
With reduced occupancy and night classes the energy use on a Friday is slightly below the weekly average. The hourly profile over the weekend is heavily influenced by the Library, rising from a baseload of 1,300 to 2,000 kWh when the library opens.
Gas Consumption
Our gas use is heavily dictated by the heating schedules and external conditions. Consumption for February came to 2,117,067 kWh, equivalent to heating a town of 1,200 homes for a month. The Main Campus steam network dominates the monthly gas consumption. The network supplies heat to the Kane, Electrical Eng, Civil Eng, Boole, Main Rest, Hub, and the Quad. The network is closely managed to match the occupancy patterns of the buildings while at the weekends the network supplies heat to the Boole Library.
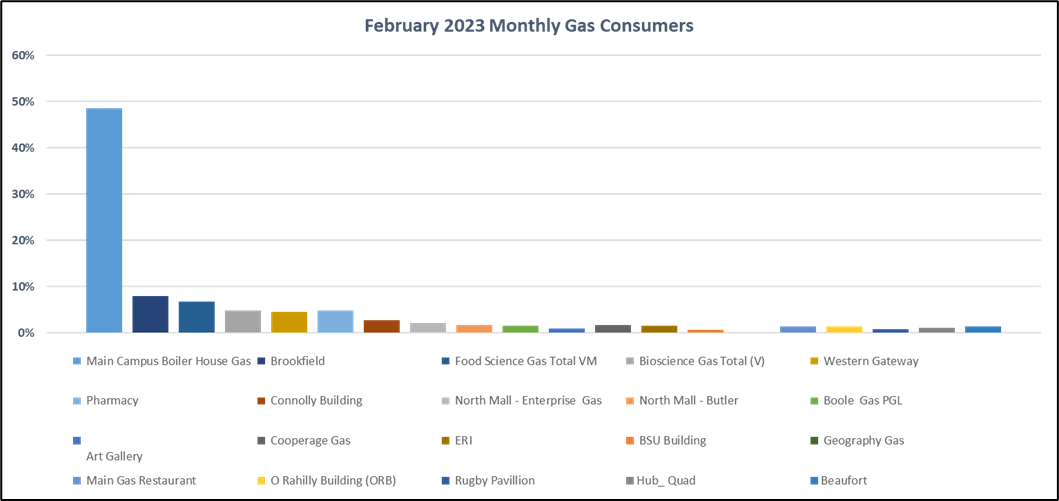
Chart 4 – Gas users for the month of February
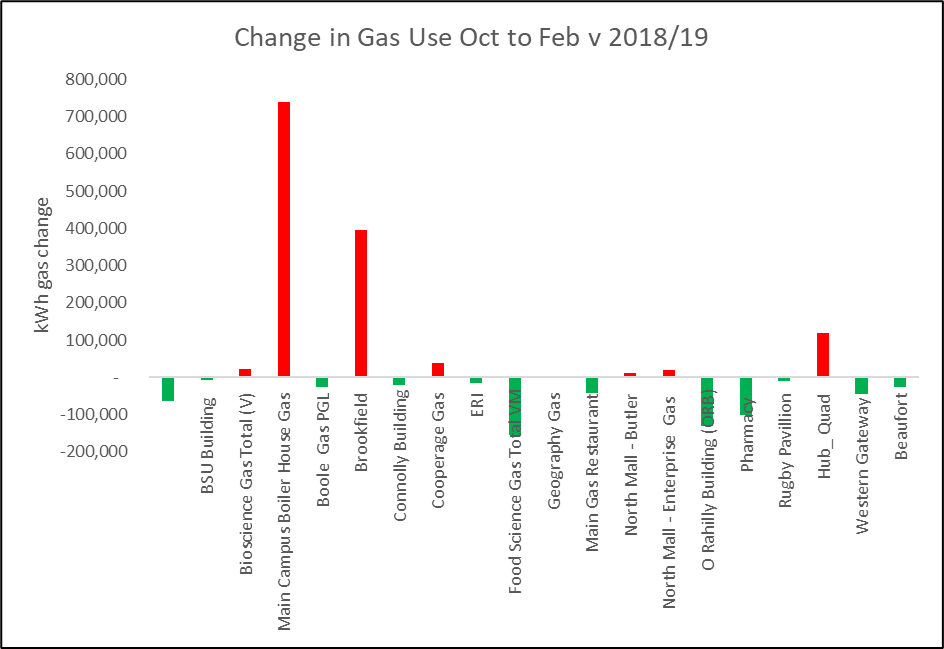
When compared to the Oct 18- Feb 19 period gas consumption overall has increased by 382,000 kWh. The increases seen in the Main Campus system can be directly attributed to the extended opening of the Library and the increased ventilation rates, post-COVID. Brookfield consumption increased as the heat recovery loops on the ventilation system were isolated (Covid measure) and room booking activity increased. The majority of buildings however reported a decrease over the baseline period as the weather was relatively milder, compared to the same period in 2018/19.
You can find out more about the heating systems by checking out our recent posts on the workvivo platform.
Energy use at Home
Concerned about rising energy bills? Not sure where all the energy is consumed at home? – Maybe a home energy monitor is just what you need. Green campus are delighted to have 3 home energy monitor units to give away. All you need to do is answer 3 questions on your home energy use. To enter the draw by clicking here. – Good Luck to all entries.
In the meantime, if you have any energy-saving ideas or suggestions please drop us an email at greencampus@ucc.ie or p.mehigan@ucc.ie